question

Upvotes
Accepted
9 2 3 9

Get data of "TR."-variables using Python API of Datastream Web Services (dsws)

Hi everyone,

I try to get mean analyst forecasts for a specific company (Volkswagen) as a daily time series. When I do this in Excel, this works with the variable "TR.EPSMean". The respective excel formula is:

TR("VOWG_p.DE";"TR.EPSMean;TR.EPSPeriodMonth;TR.EPSPeriodYear";"Period=FY1 Frq=D SDate=2010-01-01 EDate=2021-11-02 CH=Fd RH=IN;date";B2)

The output looks like this:
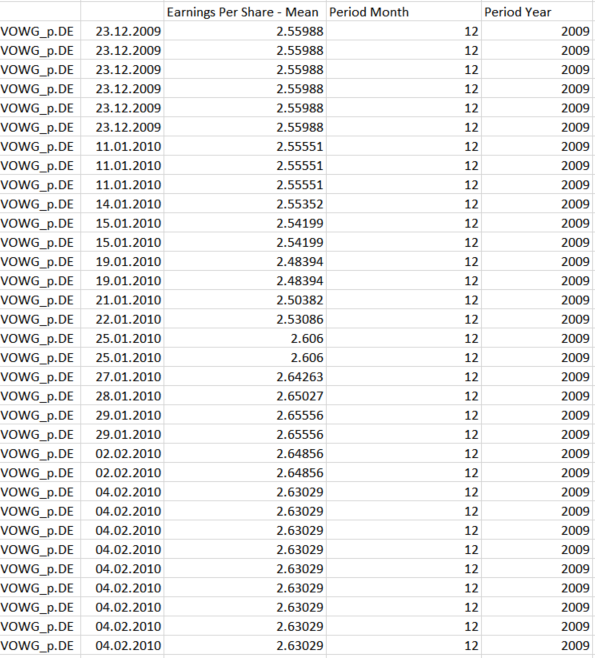
exceloutput.png

Now I try to replicate this using python and the Datastream Web Services API. I tried the following:

import DatastreamDSWS as dsws
ds = dsws.Datastream(username='<USERNAME>', password='<PASSWORD>')
data=ds.get_data(tickers='<VOWG_p.DE>',fields=['TR.EPSMean'], start='-10Y',kind=1)

Unfortunately, this returns simply "None" for the variable TR.EPSMean, Whats my mistake here?


Thank you very much for your help in advance!

dsws-api
exceloutput.png (210.6 KiB)
icon clock
10 |1500

Up to 2 attachments (including images) can be used with a maximum of 5.0 MiB each and 10.0 MiB total.

1 Answer

Upvotes
Accepted
13k 32 12 18

Hello @Eikon10,

Please see the Datastream Navigator for the list of fields that can be used for your instrument. Here is a sample request -

>>> df1 = ds.get_data(tickers='<VOWG_p.DE>', fields=['AF', 'CAI', 'DSCD', 'GEOG', 'ISIN', 'LOC', 'SECD', 'ACUR', 'ECUR', 'PYD', 'LYE', 'DEF', 'DY', 'EXDSCD', 'EXMNEM', 'EPS', 'EPSD', 'EPSF', 'EPSFD', 'Estat', 'EXNAME', 'ECNAME', 'ENAME', 'EPS1D', 'EPS2D', 'MVFF', 'GEOGC', 'GEOGN', '897E', '400E', 'ISINID', 'ISOCUR', 'MV', 'MVC', 'EPS1', 'EPS2', 'MNEM', 'NAME', 'WC01001', 'WC01001A', 'NOSH', 'EPS1PER', 'EPS2PER', 'PA', 'PB', 'PCUR', 'PH', 'PHP', 'PL', 'OP'], kind=1)
>>> df1
Instrument <VOWG_p.DE>                                       ...
Field               AF    CAI  DSCD  GEOG  ISIN   LOC  SECD  ...      PA      PB  PCUR      PH     PHP      PL     OP
Dates                                                        ...
2020-11-02           1  10.35  None  None  None  None  None  ...  127.76  127.68  None  128.92  128.92  122.96  133.8
2020-11-03           1  10.35  None  None  None  None  None  ...  131.94  131.88  None  132.68  132.68  129.14  133.8
2020-11-04           1  10.35  None  None  None  None  None  ...  131.76  131.68  None  133.10  133.10  127.28  133.8
2020-11-05           1  10.35  None  None  None  None  None  ...  136.04  135.96  None  136.50  136.50  132.62  133.8
2020-11-06           1  10.35  None  None  None  None  None  ...  133.40  133.32  None  136.44  136.44  132.62  133.8
...                ...    ...   ...   ...   ...   ...   ...  ...     ...     ...   ...     ...     ...     ...    ...
2021-10-27           1  10.35  None  None  None  None  None  ...  204.20  204.10  None  206.85  206.85  200.10  133.8
2021-10-28           1  10.35  None  None  None  None  None  ...  195.70  195.62  None  200.40  200.40  194.18  133.8
2021-10-29           1  10.35  None  None  None  None  None  ...  193.38  193.32  None  195.96  195.96  191.86  133.8
2021-11-01           1  10.35  None  None  None  None  None  ...  194.68  194.64  None  196.02  196.02  193.00  133.8
2021-11-02           1  10.35  None  None  None  None  None  ...  194.02  193.98  None  195.60  195.60  192.62  133.8

[262 rows x 50 columns]
>>>
>>>
>>> df2 = ds.get_data(tickers='<VOWG_p.DE>', fields=['PO', 'P', 'PI', 'PTBV', 'APC', 'PC', 'PE1', 'PE2', 'PE', 'PG1', 'PG2', 'TIME', 'RI', 'VO', 'TYPE', 'UP', 'P.U'], kind=1)
>>> df2
Instrument <VOWG_p.DE>                                         ...
Field               PO       P     PI  PTBV   APC    PC   PE1  ...   PG2  TIME       RI      VO  TYPE      UP   P.U
Dates                                                          ...
2020-11-02      126.26  127.78  556.2  0.58  None  1.83  None  ...  None  None  1039.65  1262.8  None  127.78  None
2020-11-03      129.66  131.74  573.4  0.59  None  1.89  None  ...  None  None  1071.87  1180.0  None  131.74  None
2020-11-04      128.50  132.08  574.9  0.59  None  1.89  None  ...  None  None  1074.64  1527.2  None  132.08  None
2020-11-05      133.94  135.92  591.6  0.61  None  1.95  None  ...  None  None  1105.88  1468.2  None  135.92  None
2020-11-06      135.00  133.16  579.6  0.60  None  1.91  None  ...  None  None  1083.42  1279.9  None  133.16  None
...                ...     ...    ...   ...   ...   ...   ...  ...   ...   ...      ...     ...   ...     ...   ...
2021-10-27      205.50  203.90  887.5  0.92  None  2.92  None  ...  None  None  1697.64   793.6  None  203.90  None
2021-10-28      199.46  194.78  847.8  0.88  None  2.79  None  ...  None  None  1621.70  1442.6  None  194.78  None
2021-10-29      194.28  193.82  843.7  0.87  None  2.78  None  ...  None  None  1613.71  1222.3  None  193.82  None
2021-11-01      194.76  194.66  847.3  0.88  None  2.79  None  ...  None  None  1620.70   676.1  None  194.66  None
2021-11-02      194.88  193.44  842.0  0.87  None  2.77  None  ...  None  None  1610.55   891.7  None  193.44  None

[262 rows x 17 columns]
icon clock
10 |1500

Up to 2 attachments (including images) can be used with a maximum of 5.0 MiB each and 10.0 MiB total.

Click below to post an Idea Post Idea