Hello, would be possible for you to create an example in python that populates a Pandas dataframe with the following data (4 columns, same order below) for a custom list of tickers (let's say for example 10 tickers of your choice), in a given time frame (i.e last 2 years) using DS data:
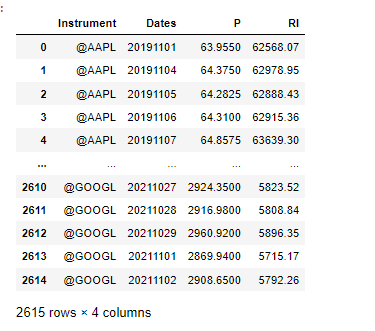
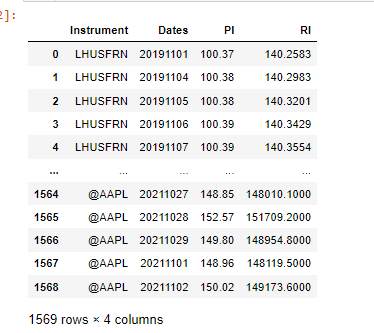
ticker, date in yyyymmdd format, last price, total return (percent change vs previous period) lagged backward one period.
The script should work on whatever timeframe is selected by the user (daily, weekly, monthly). The dataframe will be indexed on the tickers so to have all data for all tickers in one dataframe only.
The output (example with daily data) should be something like in the gif attached (so you could understand what I mean for "lagged" one period) ... here Capture.PNG, and then should continue below with the data of the second ticker, the third ... etc
I need this as a start point to understand how to download the data as well as how to handle their order (columns) and then carry out other studies.
Many thanks!


