question

Upvotes
Accepted
46 4 5 10

quote delay problem

Hello, everyone, My application receive us stock quote from trep server. For each tick I received, I will record one message receive time. After decode the tick message, I can get the tick trade time. By comparing the two time, I usually can see message receive time is about 200ms delay than tick trade time.

One possibility is the ema sdk already has the delay when it received the message from the trep server. Another possibility suppose message from trep server to ema sdk is fast enough with no delay, but my application deals the message a bit slow, so ema sdk delays the message by about 200ms then callbak my application.

Is there any method how to determine where the delay arises ?

elektronrefinitiv-realtimeelektron-sdkrrtema-apielektron-message-apidelayed-feed
icon clock
10 |1500

Up to 2 attachments (including images) can be used with a maximum of 5.0 MiB each and 10.0 MiB total.

15 Answers

Upvotes
Accepted
20.3k 73 10 20

Hi @wangfugen

I have been advised by our support team that timestamp delay issues were related to network transmission delay from our Data centre to your site.

After checking the bandwidth utilization, they found that your maximum bandwidth (50M) was regularly breached at the market open.

They further advised you to increase your private line bandwidth and check if this resolves the issue.

Can you please confirm if your network team have been able to implement the above change and if that has resolved the delayed timestamp issue?

Thanks.

icon clock
10 |1500

Up to 2 attachments (including images) can be used with a maximum of 5.0 MiB each and 10.0 MiB total.

Upvotes
46 4 5 10

I watched my log for one whole trading day, the time diff almost constants at about 200ms, so can I conclude that the delay arises because ema sdk already delayed by that time delay ?

icon clock
10 |1500

Up to 2 attachments (including images) can be used with a maximum of 5.0 MiB each and 10.0 MiB total.

Upvotes
20.3k 73 10 20

Hi @wangfugen

As a first step, consume just a few your RICS using one of our basic examples that come with EMA e.g. example 100 or 120 - with just the minor modification required to log your timestamps etc. As you may know, output to the console is not very efficient so I would recommend redirecting all output to a file for the duration of the test.

IF you continue to see approx 200ms delays with the above scenario, and your PC clock is definitely not out of time-sync, then speak to your Market Data team to diagnose and investigate this further - perhaps the TREP feed you are consuming has been intentionally delayed by your Market Data team. Many organisations do distribute both delayed and non-delayed feed internally for cost control purposes (delayed data is cheaper). Or there may be other performance issues with your TREP server implementation.

If the basic EMA example with just a few RICs does NOT record approx 200ms delays, then the problem is that your application is consuming the data too slowly, and the incoming events are being buffered - so that by the time you process the update, it has already been sat in the buffer for 200ms or thereabouts.

If that is the case, you will need to take remedial action to improve the processing performance of your application e.g. by using worker threads to offload any serious data processing out of the OnRefresh and OnUpdate msg handlers (which run on the API thread context).


icon clock
10 |1500

Up to 2 attachments (including images) can be used with a maximum of 5.0 MiB each and 10.0 MiB total.

Upvotes
46 4 5 10

Hi, @umer.nalla, Thanks for your reply. I followed your advice, modify EMA example 100 to subscribe AAPL.NB,MSFT.NB,AMZN.NB,QQQ.NB,GOOG.NB,TSLA.NB totally 6 rics. The logic in UpdateMessage is just print the message using cout operator, decoding BLKTIM_MS, ODDTIM_MS, IRGTIM_MS and SALTIM_MS those 4 fids to get the actual tick time and comparing with current machine's clock time(the server on which the cons100 runs has already ntp server on). Seen from the log, I can see the the time diff until market 9:30 is about 200ms, then when market opens, I found the maxinum time diff occured at about


symbol:TSLA.NB, desc:FID_US_ODDTIM_MS, current time:20200828213006665, quote time:20200828093001190, diff:5475

when current time is my local time(UTC+8) and quote time is EST time. The diff arrives at 5475ms, then the diff decrease until the follow log:

symbol:TSLA.NB, desc:FID_US_ODDTIM_MS, current time:20200828213010183, quote time:20200828093010011, diff:172
symbol:TSLA.NB, desc:FID_US_ODDTIM_MS, current time:20200828213010185, quote time:20200828093010011, diff:174

which means that about 10s after market open, the diff return to about 200ms again.

I also modified my original application, which subscribes the whole nasdaq basic market rics(about 9000), using the same logic process UpdateMsg. Generally roughly the same result as above. So maybe I should consult market data team for the reason of the delay ?

icon clock
10 |1500

Up to 2 attachments (including images) can be used with a maximum of 5.0 MiB each and 10.0 MiB total.

Upvotes
20.3k 73 10 20

Hi @wangfugen

The field ODDTIM_MS is described as 'Time of odd-lot trade with precision in milliseconds' - i.e. the time of a trade where order amount was less than the normal unit of trading.

Also, a 5s delay seems unexpectedly high - I am not a content expert but I am not sure if this field is a valid one for comparing with the local machine's time - as it could represent the time of an odd lot trade that took place a while ago.

In terms of the latency (delay), you can also ask your Market Data team if they can run some test with your simple example connecting directly to the incoming feed e.g. Elektron Edge device. This would bypass the TREP server - to get an idea of the amount of latency being introduced by your organisation's TREP implementation.

I will try and ascertain internally about the significance of ODDTIM_MS - however, feel free to raise a Content ticket at My.Refinitiv so that an expert can perhaps explain the time difference you are seeing.


icon clock
10 |1500

Up to 2 attachments (including images) can be used with a maximum of 5.0 MiB each and 10.0 MiB total.

Upvotes
46 4 5 10

Hi, @umer.nalla Thanks for your reply. I did another test yesterday, registering only AAPL.NB in example cons100. In the callback OnUpdateMsg, I cout the message, and extract BLKTIM_MS, ODDTIM_MS, IRGTIM_MS and SALTIM_MS, comparing with local time, only to find that the delay reaches with maximum value 14s. The more log can be found in my attachment.

symbol:AAPL.NB, desc:ODDTIM_MS, current time:20200902213017024, quote time:20200902093002852, diff:14172
symbol:AAPL.NB, desc:SALTIM_MS, current time:20200902213017025, quote time:20200902093002856, diff:14169


symbol: is fixed registered symbol AAPL.NB

desc: the fid name extracted for tick time

current time: the local time in millisecond precision

quote time: the tick time in millisecond

diff: delay between current time and quote time (considering timezone diff)


So, I have following question:

1、is the delay arise from my slowness in UpdateMsg ? Generally the logic in UpdateMsg is cout the message and extract above fields without much logic, it should not be that slow

2、is there anyway I can get the exact time of each UpdateMsg that arrived at EMA SDK ? Or how can I check if message sat in EMA SDK internal buffer too long due to callback function's slowness ?

icon clock
10 |1500

Up to 2 attachments (including images) can be used with a maximum of 5.0 MiB each and 10.0 MiB total.

Upvotes
20.3k 73 10 20

Hi @wangfugen

Is the 14s delay appearing immediately or gradually over time e.g. does it start with minimal delay and then as the application continues running the delay gets longer? How long before you see the 14s delay?

If that is the case, then in theory that could suggest that your consumer is slow and the buffer is filling up with data. However, if you are only consuming one single RIC then it does not make any sense that you have a slow consumer - especially if all you are doing with the update message is extracting a few fields and dumping them out. Also, with a slow consumer, the application is usually disconnected by the server after a short while, because it can only buffer so much data for each connection.

Also, with the cout - are you redirecting to a file or directly to the screen? If the problem is as described above - i.e. the delay gradually increases, and you are outputting to the screen, please repeat the above with output redirected to the file.

We have client developers who are consuming several thousand relatively volatile instruments using a single EMA Java consumer without any issue. Slow consumer issues usually arise when too much work is carried out on the API thread in the onUpdateMsg handler etc - which is not what you are describing.

However, if the delay appears on the first update message then this would indicate some other issue and I would recommend you raise a content ticket and speak to your Market Data team as well.

icon clock
10 |1500

Up to 2 attachments (including images) can be used with a maximum of 5.0 MiB each and 10.0 MiB total.

Upvotes
46 4 5 10

The 14s delay appears gradually. The first several message since open time 9:30 as follows:

symbol:AAPL.NB, desc:IRGTIM_MS, current time:20200902213000337, quote time:20200902093000000, diff:337
symbol:AAPL.NB, desc:ODDTIM_MS, current time:20200902213000337, quote time:20200902093000000, diff:337
symbol:AAPL.NB, desc:ODDTIM_MS, current time:20200902213000521, quote time:20200902093000003, diff:518

the diff values increses by the following logs arriving maximum delay:

symbol:AAPL.NB, desc:SALTIM_MS, current time:20200902213017036, quote time:20200902093002909, diff:14127
symbol:AAPL.NB, desc:SALTIM_MS, current time:20200902213017036, quote time:20200902093002912, diff:14124
symbol:AAPL.NB, desc:ODDTIM_MS, current time:20200902213017036, quote time:20200902093002918, diff:14118

and then delay start to decrease, by following log to normal delay 200ms

symbol:AAPL.NB, desc:ODDTIM_MS, current time:20200902213021346, quote time:20200902093021108, diff:238
symbol:AAPL.NB, desc:ODDTIM_MS, current time:20200902213021347, quote time:20200902093021124, diff:223
symbol:AAPL.NB, desc:ODDTIM_MS, current time:20200902213021347, quote time:20200902093021168, diff:179
symbol:AAPL.NB, desc:ODDTIM_MS, current time:20200902213021390, quote time:20200902093021221, diff:169
symbol:AAPL.NB, desc:SALTIM_MS, current time:20200902213021441, quote time:20200902093021267, diff:174


For the above output, I use printf in my test program and redirect stdout to file for further investigation.

Now I plan to do following test to check if delay from sdk or my OnUpdateMsg logic.

Program 1: In OnUpdateMsg function, I keep a message counter, print out each 10 message arrives, then return.

Program 2: Do same as above, but not return. I furture try to extract the TIM_MS fields described above for checking delay.


Both output are redirected to file. On market open, I compare the counter printed from both programs. There are two possibilities:

Case 1: If counter from Program 1 gradually diff from Program 2 to an extent that reach maximum delay, and gradually become same again when diff returns to normal, then the extra extract fid logic delays message receiving greatly.

Case 2: The counter from both program does not diff much, which means data from ema sdk is delayed internally.


I will check comparison result tonight and report again. Thanks @umer.nalla

icon clock
10 |1500

Up to 2 attachments (including images) can be used with a maximum of 5.0 MiB each and 10.0 MiB total.

Upvotes
20.3k 73 10 20

Hi @wangfugen

Thanks for the update.

In addition to the testing, I do recommend you confirm with the content helpdesk via My.Refinitiv regards the appropriateness of the fields you are using for your delay comparison.


icon clock
10 |1500

Up to 2 attachments (including images) can be used with a maximum of 5.0 MiB each and 10.0 MiB total.

Upvotes
46 4 5 10

@umer.nalla Thanks for your reply.

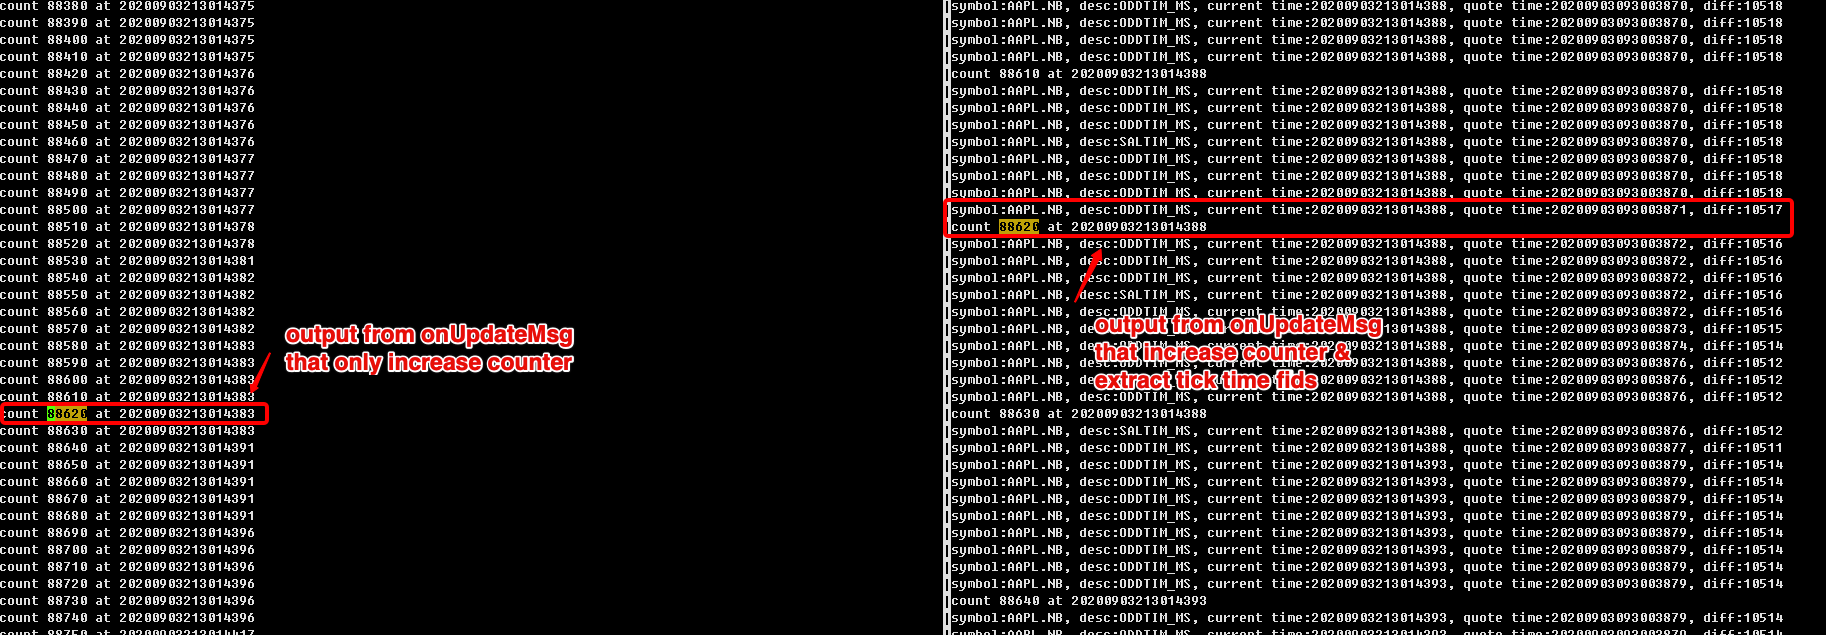
Now I update the latest test result with above picture:

The left pane is output from Program 1 that only increase message counter.

The right pane is output from Program 1 that increase message counter and extract tick fields.

From the comparision above, Both programs processes 88620 message about the the same, with diff in 5ms. But the delay from right pane arrives about 10s.

So I can conclude now that the delay is from latency of SDK when it receives and passes the message to onUpdateMessage. I contacted content helpdesk for several days but without much progress. Maybe the test result above can be provided to them for further investigation.


1599140475152.png (172.5 KiB)
icon clock
10 |1500

Up to 2 attachments (including images) can be used with a maximum of 5.0 MiB each and 10.0 MiB total.

Upvotes
20.3k 73 10 20

Hi @wangfugen

Thanks for clarifying the difference in your testing - I understand the situation better now.

Am I right in thinking the left hand pane is updating the message counter in the onUpdateMsg?

If that is the case, then the latency of the SDK does not make sense as the cause - since you are still being passed the updateMsg payload in both versions of the onUpdateMsg?

The only difference is you are parsing the fields in the right-hand side example and that for some reason the parsing of the data is adding latency in quite a dramatic way.

I think at this stage, you could share your code for the right-hand example here and we can try and recreate it.

However, I think the better approach is that you raise an API Support ticket with our Developer Support team - who can work with you directly offline to test your application, try and recreate your scenario and identify the cause + provide a solution. Note that this is not the same as the Content Helpdesk - this is API support for cases which cannot be easily resolved here on the forum.


icon clock
10 |1500

Up to 2 attachments (including images) can be used with a maximum of 5.0 MiB each and 10.0 MiB total.

Upvotes
46 4 5 10

Consumer.h.txtConsumer.cpp.txt

@umer.nalla Thanks for your reply. The attachment is my test code built under Cons100 directory.

The left pane is run with following command with stdout recirected to aapl-20200903-count.log:

./Cons100 -h 10.56.125.112:14002 -s ELEKTRON_DD -u user14 -r AAPL.NB -c > aapl-20200903-count.log &

The right pane is run with following command with stdout recirected to aapl-20200903-diff.log:

 ./Cons100 -h 10.56.125.112:14002 -s ELEKTRON_DD -u user12 -r AAPL.NB > aapl-20200903-diff.log &


The difference is the '-c' flag which controls whether only increase and print message counter.


consumerh.txt (1.4 KiB)
consumercpp.txt (11.8 KiB)
icon clock
10 |1500

Up to 2 attachments (including images) can be used with a maximum of 5.0 MiB each and 10.0 MiB total.

Upvotes
20.3k 73 10 20

Hi @wangfugen

Thanks for providing the source code.

I have taken an initial look at the code - and as I mentioned above - the delay is most likely being caused by your processing/parsing of the payload when not in counter only mode.

I say this because, regardless of whether the example is running in counter mode or tick extract mode, the API still calling the onUpdateMsg on the API thread context and passing the payload to the application. Any delay difference between the two different modes is therefore down to the processing being done to the payload by the application.

One thing I note is that you are iterating through the field list multiple times i.e. calling GetFieldEntryByID() for each FID in your tick_map. This does not seem the most efficient way of doing this. Ideally, you should only iterate through the field list once, and check each field id in the field list to see if it is one you are interested in and then stop iterating once all required fields have been extracted. You can further optimise this by using a View request to ask the server to filter the payload and only send you the fields that you are interested in - please see example 360__MarketPrice__View - which asks the server to only send BID and ASK.

One thing to note is if the server is very busy, it can sometimes ignore the view request and send all the fields - so as not affects its ability to serve all other connected consumers. So, your code should allow for the possibility of receiving a fuller field list.

The other thing to note is that for scenarios where you are doing considerable work in the onUpdateMsg handler, it is often recommended to spawn a separate worker thread so that the API thread context is not used for too long by your application processing of the payload. However, this is not something normally required until dealing with a large list of instruments and doing considerable processing of the payload.

If you require further investigation of this issue, I do recommend you raise an API Support ticket with our Developer Support team - who can spend the additional time required to investigate this.


icon clock
10 |1500

Up to 2 attachments (including images) can be used with a maximum of 5.0 MiB each and 10.0 MiB total.

Upvotes
46 4 5 10

@umer.nalla Thanks for your reply. I'm a bit puzzled at your words:

I have taken an initial look at the code - and as I mentioned above - the delay is most likely being caused by your processing/parsing of the payload when not in counter only mode.


In counter mode, the onUpdateMsg just increase message counter with minimum operation. So I can say it Should not cause delay, or else whatever I do in onUpdateMsg will cause more delay. Right ?

Seen from yesterday's test result, program processed 88620 message by time 20200903093014383 when in counter mode, but in tick extract mode, it processed the same 88620 message by time 20200903093014388. That's to say, the two program almost process message at the same speed. But we can see from tick extract mode that tick time is delayed by 10s comparing to local time.


icon clock
10 |1500

Up to 2 attachments (including images) can be used with a maximum of 5.0 MiB each and 10.0 MiB total.

Upvotes
20.3k 73 10 20

Hi @wangfugen

My sincere apologies, I misunderstood your earlier post to mean that the tick mode was taking 10s longer to process the same number of messages.

Giving that the same number of messages are being processed in pretty much the same time, and you are only consuming a single RIC - it does not make sense that the API is delaying the data by as much as 10s.

Therefore, as per my earlier comments, the most logical explanation would be that the field ODDTIM_MS is not appropriate for doing timing / latency checks.

I can see that you already raised a Content ticket - but due to language limitations, I cannot understand the response/help you received.

Therefore, I will raise another Content ticket on your behalf and liaise with the Content team to hopefully arrive at a better understanding of the data and time difference. You may receive a separate email from the Content team.

icon clock
10 |1500

Up to 2 attachments (including images) can be used with a maximum of 5.0 MiB each and 10.0 MiB total.

Click below to post an Idea Post Idea