Hi. I am quite new with Eikon Python API. I would like to ask how to get a series of historical Implied Volatility for a list of RICs. For example, close of day implied volatility from 2000-2010 for US energy sector. Thanks a lot.
- Home
- Anonymous
- Sign in
- Create
- Post an idea
- Create an article
- Spaces
- Alpha
- App Studio
- Block Chain
- Bot Platform
- Connected Risk APIs
- DSS
- Data Fusion
- Data Model Discovery
- Datastream
- Eikon COM
- Eikon Data APIs
- Electronic Trading
- Elektron
- Intelligent Tagging
- Legal One
- Messenger Bot
- Messenger Side by Side
- ONESOURCE
- Open Calais
- Open PermID
- Org ID
- PAM
- ProView
- ProView Internal
- Product Insight
- Project Tracking
- RDMS
- Refinitiv Data Platform
- Rose's Space
- Screening
- Side by Side Integration API
- TR Knowledge Graph
- TREP APIs
- TREP Infrastructure
- TRKD
- TRTH
- Thomson One Smart
- Transactions
- Velocity Analytics
- Wealth Management Web Services
- Workspace SDK
- World-Check Data File
- 中文论坛
- Explore
- Tags
- Questions
- Ideas
- Articles
- Users
- Badges
For a deeper look into our Eikon Data API, look into:
Overview | Quickstart | Documentation | Downloads | Tutorials | Articles
question
Series of hstorical implied volatility for a list of RICs

Hi @songqirong
Thanks for the sample formula in Eikon Excel
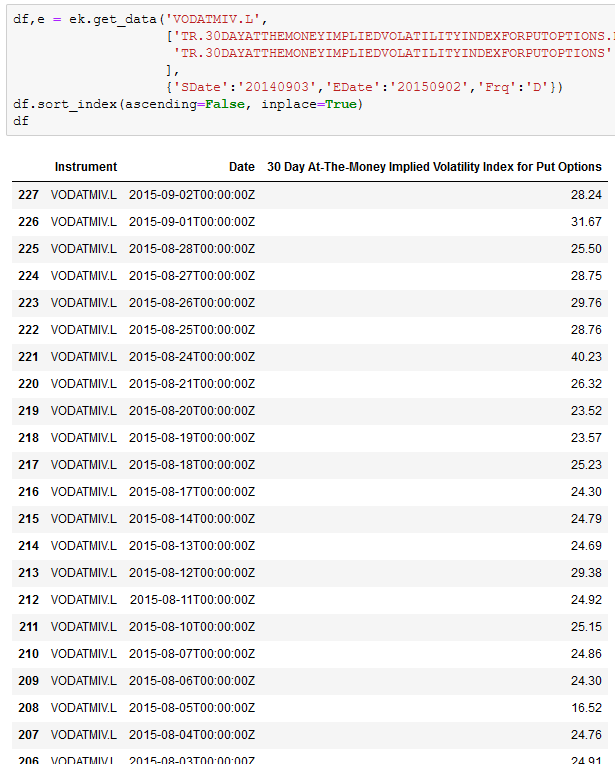
Please try this code:
df,e = ek.get_data('VODATMIV.L',
                   ['TR.30DAYATTHEMONEYIMPLIEDVOLATILITYINDEXFORPUTOPTIONS.Date',
                    'TR.30DAYATTHEMONEYIMPLIEDVOLATILITYINDEXFORPUTOPTIONS'
                   ],
                   {'SDate':'20140903','EDate':'20150902','Frq':'D'})
df.sort_index(ascending=False, inplace=True)
df
Output:


Hello @songqirong
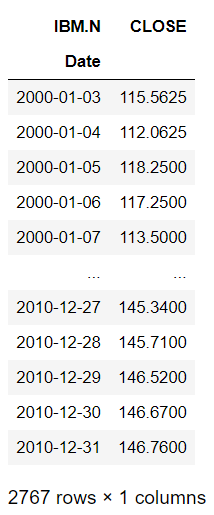
Eikon Python API provides get_timeseries(..) function which returns historical data on one or several RICs. The function can return the following fields: 'TIMESTAMP', 'VALUE', 'VOLUME', 'HIGH', 'LOW', 'OPEN', 'CLOSE', 'COUNT'
The example to get close price:
import pandas as pd
import eikon as ek
#set app key to identify the application on Eikon, Eikon Proxy or Refinitiv Platform
ek.set_app_key(<The application key>)
#get historical close price of RIC IBM.N from 2000-01-01 till 2010-12-31
df = ek.get_timeseries('IBM.N', 'CLOSE', interval='daily', start_date='2000-01-01', end_date='2010-12-31')
#display time series data frame
df


Typically, you can use the get_data method to get time series data. However, I am not sure Eikon can provide historical implied volatility. I only found the real-time field (IMP_VOLT) for implied volatility.
You can verify this by directly contacting the Eikon support team via MyRefiniiv and asking for the TR formula in Eikon Excel which can be used to retrieve historical implied volatility.


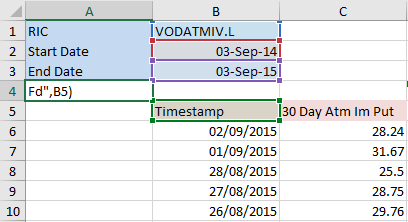
Thank you very much. I have got the TR formula to retrieve historical implied volatility. For example, =RHistory($B$1,"30D_A_IM_P.Timestamp;30D_A_IM_P.Value","START:"&$B$2&" END:"&$B$3&" INTERVAL:1D",,"CH:Fd",B5)
And the output looks like

May I ask whether I can adapt the excel formula to the "get_data" method in python API? One of the critical drawback of the excel plug in is that it takes quite a long time to update.


