question

Upvotes
Accepted
5 1 0 1

How to get data using LIST# function for changing Instruments as one time series data

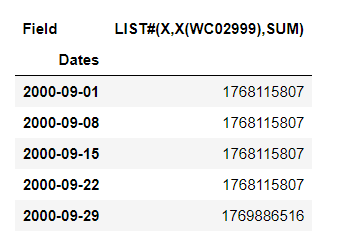
I'm trying to get the sum of all assets of stocks in the ASX 200 Index. However, the constituent stocks of the index change over time. Therefore, i tried running a while loop for the following DFO function.

=DSGRID("LASX200I0900","LIST#(X,X(WC02999),SUM)","2000-09-01","2000-09-21","W","RowHeader=true;ColHeader=true;DispSeriesDescription=false;YearlyTSFormat=false;QuarterlyTSFormat=false","")

- where the instrument "LASX200I0900" gets updated for every loop, i.e. constituents for Sep 2000 becomes LASX200I0900, for Oct 2000 becomes LASX200I1000 (So LASX200I+mmyy).

My guess is that as Instruments change, DatastreamDSWS class cannot contain it as one time series and causing issue.


Would appreciate if you can assist - whether it be resolving the error, or advise on a different approach.
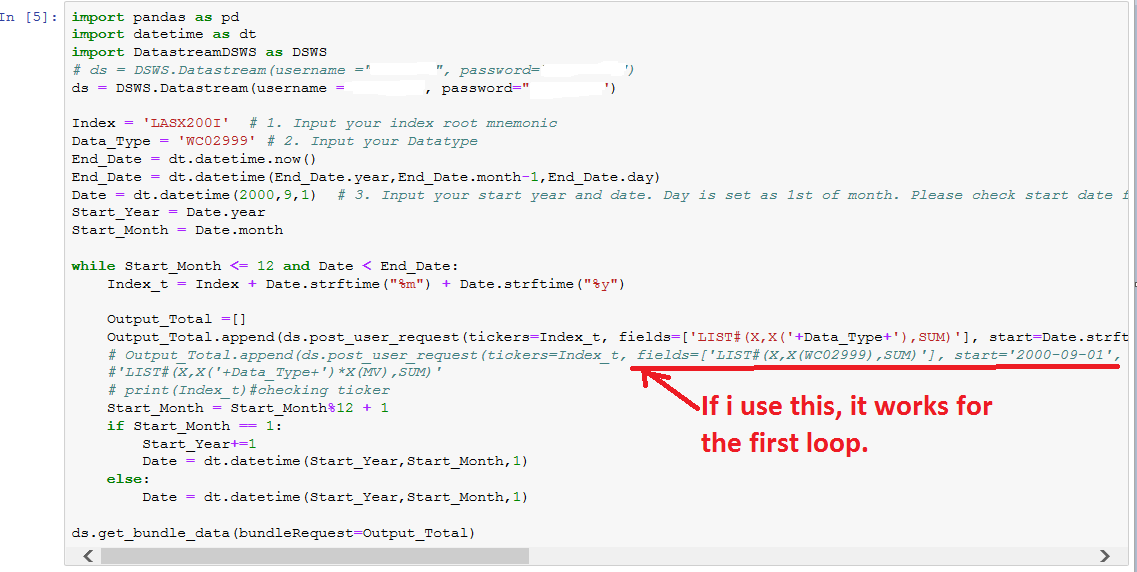


PYTHON CODE: You can copy paste the following into Jupyter notebook (for some reason cannot upload the file itself)


import pandas as pd

import datetime as dt

import DatastreamDSWS as DSWS

# ds = DSWS.Datastream(username ="username", password="password")

ds = DSWS.Datastream(username ="username", password="password")


Index = 'LASX200I' # 1. Input your index root mnemonic

Data_Type = 'WC02999' # 2. Input your Datatype

End_Date = dt.datetime.now()

End_Date = dt.datetime(End_Date.year,End_Date.month-1,End_Date.day)

Date = dt.datetime(2000,9,1) # 3. Input your start year and date. Day is set as 1st of month. Please check start date from DS

Start_Year = Date.year

Start_Month = Date.month


while Start_Month <= 12 and Date < End_Date:

Index_t = Index + Date.strftime("%m") + Date.strftime("%y")


Output_Total =[]


Field1 = 'LIST#(X,X(' + Data_Type + '),SUM)'

Start = Date.strftime("%Y") + '-' + Date.strftime("%m") + '-' + Date.strftime("%d")

End = Date.strftime("%Y") + '-' + Date.strftime("%m") + '-' + str(Date.day+21)

# print(Start,End)

Output_Total.append(ds.post_user_request(tickers=Index_t, fields=[Field1], start=Start, end=End, freq = "w"))#Timeseries data

#Output_Total.append(ds.post_user_request(tickers=Index_t, fields=['LIST#(X,X(WC02999),SUM)'], start='2000-09-01', end='2000-09-21', freq = "W"))#Timeseries data

#'LIST#(X,X('+Data_Type+')*X(MV),SUM)'

# print(Index_t)#checking ticker

Start_Month = Start_Month%12 + 1

if Start_Month == 1:

Start_Year+=1

Date = dt.datetime(Start_Year,Start_Month,1)

else:

Date = dt.datetime(Start_Year,Start_Month,1)


ds.get_bundle_data(bundleRequest=Output_Total)

datastream-apidsws-api
1582791651995.png (69.4 KiB)
icon clock
10 |1500

Up to 2 attachments (including images) can be used with a maximum of 5.0 MiB each and 10.0 MiB total.

Upvotes
Accepted
38.1k 71 35 53

@bob.kim

Therefore, we need to concatenate all data frames into one. The code could be:

Index = 'LASX200I' # 1. Input your index root mnemonic
Data_Type = 'WC02999' # 2. Input your Datatype
End_Date = dt.datetime.now()
End_Date = dt.datetime(End_Date.year,End_Date.month-1,End_Date.day)
Date = dt.datetime(2000,9,1) # 3. Input your start year and date. Day is set as 1st of month. Please check start date from DS
Start_Year = Date.year
Start_Month = Date.month
Output_Total =[]
while Start_Month <= 12 and Date < End_Date:
    Index_t = Index + Date.strftime("%m") + Date.strftime("%y")
    Field1 = 'LIST#(X,X(' + Data_Type + '),SUM)'
    Start = Date.strftime("%Y") + '-' + Date.strftime("%m") + '-' + Date.strftime("%d")
    End = Date.strftime("%Y") + '-' + Date.strftime("%m") + '-' + str(Date.day+21)
    Output_Total.append(ds.post_user_request(tickers=Index_t, fields=[Field1], start=Start, end=End, freq = "W"))#Timeseries data  
    Start_Month = Start_Month%12 + 1
    if Start_Month == 1:
        Start_Year+=1
        Date = dt.datetime(Start_Year,Start_Month,1)
    else:
        Date = dt.datetime(Start_Year,Start_Month,1)
        
#Split array to size of 20
dfList=[]
n=20
final_list = [Output_Total[i * n:(i + 1) * n] for i in range((len(Output_Total) + n - 1) // n )]  
for _list in final_list:    
   #dataList.append(ds.get_bundle_data(bundleRequest=_list))
    outList = ds.get_bundle_data(bundleRequest=_list)
    for _df in outList:
        if(isinstance(_df.columns, pd.core.indexes.multi.MultiIndex)):
            _df.columns = _df.columns.droplevel()
            dfList.append(_df)

result = pd.concat(dfList)
result

The result is:


1583133054348.png (11.0 KiB)
icon clock
10 |1500

Up to 2 attachments (including images) can be used with a maximum of 5.0 MiB each and 10.0 MiB total.

Awesome! Very much appreciated!

Upvotes
38.1k 71 35 53

@bob.kim

The code should be:

Index = 'LASX200I' # 1. Input your index root mnemonic
Data_Type = 'WC02999' # 2. Input your Datatype
End_Date = dt.datetime.now()
End_Date = dt.datetime(End_Date.year,End_Date.month-1,End_Date.day)
Date = dt.datetime(2000,9,1) # 3. Input your start year and date. Day is set as 1st of month. Please check start date from DS
Start_Year = Date.year
Start_Month = Date.month
Output_Total =[]
while Start_Month <= 12 and Date < End_Date:
    Index_t = Index + Date.strftime("%m") + Date.strftime("%y")
    Field1 = 'LIST#(X,X(' + Data_Type + '),SUM)'
    Start = Date.strftime("%Y") + '-' + Date.strftime("%m") + '-' + Date.strftime("%d")
    End = Date.strftime("%Y") + '-' + Date.strftime("%m") + '-' + str(Date.day+21)
    Output_Total.append(ds.post_user_request(tickers=Index_t, fields=[Field1], start=Start, end=End, freq = "W"))#Timeseries data  
    Start_Month = Start_Month%12 + 1
    if Start_Month == 1:
        Start_Year+=1
        Date = dt.datetime(Start_Year,Start_Month,1)
    else:
        Date = dt.datetime(Start_Year,Start_Month,1)
        
#Split array to size of 20
n=20
final_list = [Output_Total[i * n:(i + 1) * n] for i in range((len(Output_Total) + n - 1) // n )]  
for _list in final_list:    
    print(ds.get_bundle_data(bundleRequest=_list))

The maximum size of a bundle request is 20.

icon clock
10 |1500

Up to 2 attachments (including images) can be used with a maximum of 5.0 MiB each and 10.0 MiB total.

Thanks so much for this!! However, i have one follow up question.

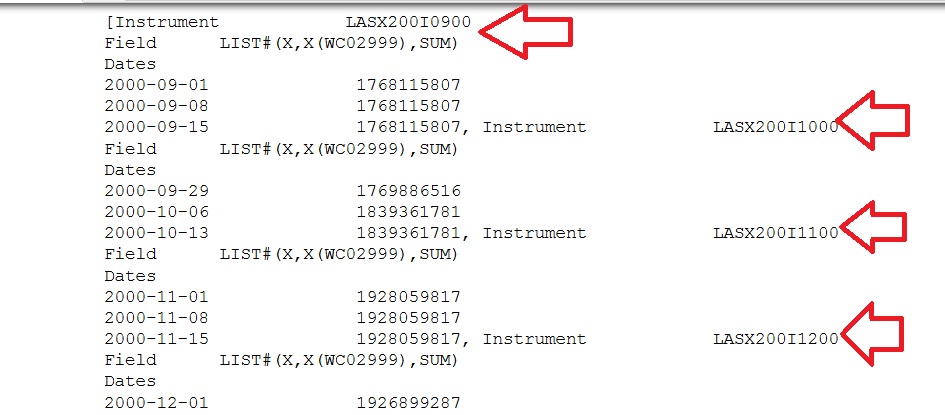
As you can see, each loop will display Instrument, Field, etc...which does not present the time series into one set (pls see below screen shot). However, i want to get it as one time series so that i can seamlessly plot it in a chart. In other words, i don't want the time series to be divided into different time series. I only need it as one, and don't need instrument information.

To do this, i tried to change the Output_Total list into a data frame, and then printing it. However, this does not work. What would be the best way to go about this?

Code attached in next comment section

untitled.jpg (94.9 KiB)
Upvotes
5 1 0 1

Thanks However, I'm trying to save this as one '1' timeseries without dividing it by instruments. Can we not use Bundle? I tried changing the Output_Total list into Data Frame but seems like it is incorrect. My code is below:

import pandas as pd

import datetime as dt

import DatastreamDSWS as DSWS

import IPython as myIP

ds = DSWS.Datastream(username ="USERNAME", password="PASSWORD")


Index = 'LASX200I' # 1. Input your index root mnemonic

Data_Type = 'WC02999' # 2. Input your Datatype

#End_Date = dt.datetime.now()

End_Date = dt.datetime(2001,3,30)

Date = dt.datetime(2000,9,1) # 3. Input your start year and date. Day is set as 1st of month. Please check start date from DS

Start_Year = Date.year

Start_Month = Date.month

Output_Total =[]


while Start_Month <= 12 and Date < End_Date:

Index_t = Index + Date.strftime("%m") + Date.strftime("%y")

Field1 = 'LIST#(X,X(' + Data_Type + '),SUM)'

Start = Date.strftime("%Y") + '-' + Date.strftime("%m") + '-' + Date.strftime("%d")

End = Date.strftime("%Y") + '-' + Date.strftime("%m") + '-' + str(Date.day+14)

Output_Total.append(ds.post_user_request(tickers=Index_t, fields=[Field1], start=Start, end=End, freq = "W"))#Timeseries data

Start_Month = Start_Month%12 + 1

if Start_Month == 1:

Start_Year+=1

Date = dt.datetime(Start_Year,Start_Month,1)

else:

Date = dt.datetime(Start_Year,Start_Month,1)


DF_Output_Total = pd.DataFrame(Output_Total)

print(DF_Output_Total)

icon clock
10 |1500

Up to 2 attachments (including images) can be used with a maximum of 5.0 MiB each and 10.0 MiB total.

Click below to post an Idea Post Idea