For a deeper look into our Eikon Data API, look into:

Overview |  Quickstart |  Documentation |  Downloads |  Tutorials |  Articles

question

Upvotes
Accepted
3 0 1 1

Historical data : MarketCap of all listed companies in Japan.

I'm struggling with combining ① wiht ②. I'd greatly appreciate any suggestions you might have.


① I can get all listed companies in Japan with the below.

universe='SCREEN(U(IN(Equity(active,public,primary))/*UNV:Public*/),IN(TR.ExchangeCountryCode,"JP"), IN(TR.InstrumentTypeCode,"ORD"), CURN=JPY)'

data, err = ek.get_data(instruments=universe, fields=['TR.CommonName'])

data.head()

② I can get the historical data of some companies' MarketCap like this.

data= ek.get_data(['2195.T','3639.T','3640.T','3641.T'], ['TR.CompanyMarketCap'],

{'SDate': '2019-8-31', 'EDate':'2015-9-30', 'Period':'FQ0','FRQ': 'M','Scale': 6})

print(data)

by @tnksnsk314

eikoneikon-data-apiworkspaceworkspace-data-apirefinitiv-dataplatform-eikonpythondatahistorical
icon clock
10 |1500

Up to 2 attachments (including images) can be used with a maximum of 5.0 MiB each and 10.0 MiB total.

Upvote
Accepted
18k 21 12 20

Hi @Shinsuke.Tanaka

I would suggest you to split the call into 2 calls.

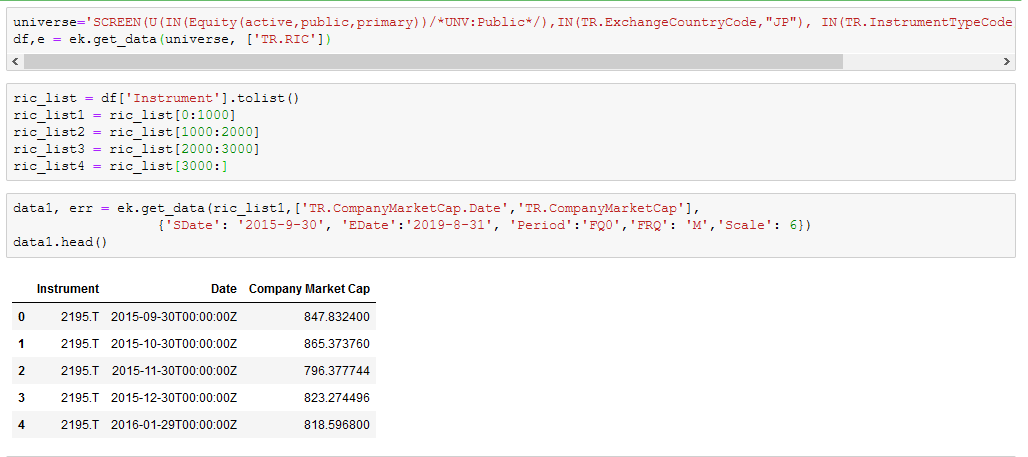
1. Get RIC list first

universe='SCREEN(U(IN(Equity(active,public,primary))/*UNV:Public*/),IN(TR.ExchangeCountryCode,"JP"), IN(TR.InstrumentTypeCode,"ORD"), CURN=JPY)'
df,e = ek.get_data(universe, ['TR.RIC'])
ric_list = df['Instrument'].tolist()

#split the list into a smaller list (to avoid hitting limit)
ric_list1 = ric_list[0:1000]
ric_list2 = ric_list[1000:2000]
ric_list3 = ric_list[2000:3000]
ric_list4 = ric_list[3000:]


2. Get MarketCap and MarketCap date from the RIC list

data1, err = ek.get_data(ric_list1,['TR.CompanyMarketCap.Date','TR.CompanyMarketCap'],
                  {'SDate': '2015-9-30', 'EDate':'2019-8-31', 'Period':'FQ0','FRQ': 'M','Scale': 6})
data1.head()

Here is sample output:


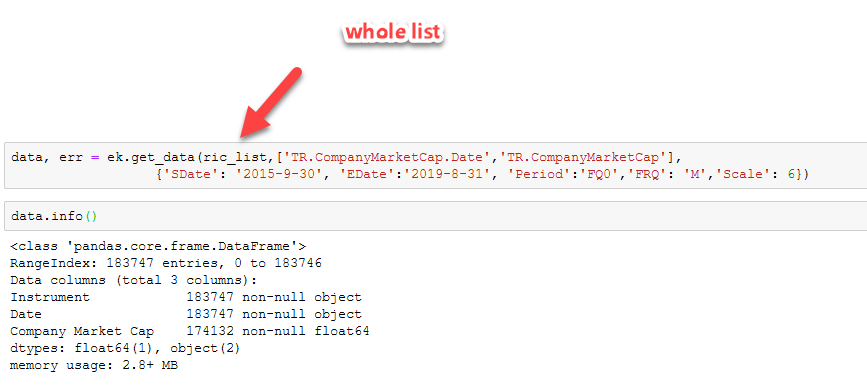
I was able to get the data back from the whole list at once, but this is not suggested.


ahs.png (29.7 KiB)
ahs2.png (26.5 KiB)
icon clock
10 |1500

Up to 2 attachments (including images) can be used with a maximum of 5.0 MiB each and 10.0 MiB total.

@chavalit.jintamalit

I understood. I will do it and show my client. Thank you! regards, Shinsuke

Upvote
9.7k 49 38 60

Hi @Shinsuke.Tanaka,

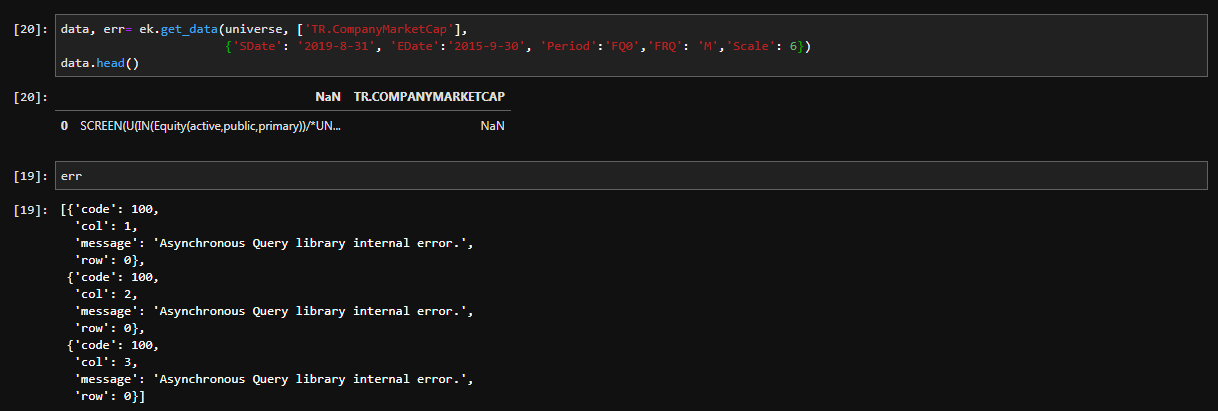
You didn't provide the details of what happens when you combine ① with ②. I'll assume you received output such as this (Note: I also echoed the err value to the screen):

I have not seen this error before but my suspicions are that you have exceeded a data limit. The data range you specified includes 48 different periods between each instrument. Limiting your date range will actually return a valid result.

For example:


ahs.png (17.4 KiB)
ahs.png (10.3 KiB)
icon clock
10 |1500

Up to 2 attachments (including images) can be used with a maximum of 5.0 MiB each and 10.0 MiB total.

Upvotes
3 0 1 1

I appreciate your suggetion. I'd like to have the result along with date like 2019/8/31, 2019/7/31. Which field should I put in the program?

icon clock
10 |1500

Up to 2 attachments (including images) can be used with a maximum of 5.0 MiB each and 10.0 MiB total.

Upvote
9.7k 49 38 60

You can apply the TR.CompanyMarketCap.Date field to your fields list. Refer to the DIB (Data Item Browser) within Eikon for a list of available fields/parameters.

Note: Because a new field is added, this will further reduce the date range as the new field contributes to the size of the data set. I would suggest you break down your universe if you want a specific date range as part of your result.


ahs.png (13.7 KiB)
icon clock
10 |1500

Up to 2 attachments (including images) can be used with a maximum of 5.0 MiB each and 10.0 MiB total.

@Nick.Sincone.1

Thank you! I didn't notice the field in DIB. regards, Shinsuke

Click below to post an Idea Post Idea