For a deeper look into our Eikon Data API, look into:

Overview |  Quickstart |  Documentation |  Downloads |  Tutorials |  Articles

question

Upvotes
Accepted
21 0 0 4

MissingSchema: Invalid URL 'None': No schema supplied. Perhaps you meant http://None?


Hi everybody.

first of all thank you so much for that great community!

I still have the same error and have not found any solution yet!
What can I check and what kind of solution do I have?


1. license

Customer support checked license and we do have access to to the Eikon API - (premium account)

2. Version

>> import eikon
>> eikon.__version__
=> I do have version '1.0.0' as a result

3. Could you check response on following url ?

3 . API Proxy

  • check folder
    C:\ProgramData\Thomson Reuters\Eikon Data\Logs\TRD
  • File to check in the folder should have format like this:
    SxS.yyyymmdd.hhmmss.txt file
  • Entry to find should look like this:
    [2018-03-08 10:23:23.773|prod] (app) PO: SIDEBYSIDE,APIPROXY.

    => Only entry in the file I scan find is as following:
start node 
Arg: C:\Program Files (x86)\Thomson Reuters\Eikon\Y\Bin\Eikonbox.exe C:\Users\R\AppData\Local\Thomson Reuters\Eikon User\Cache\LibraryCache\Apps\THOMSONREUTERS.EIKON.DESKTOPSXSSVC\1.1.0.69\index.js -TraceLevel=-1 

You should find an entry like this...
[2018-03-08 10:23:23.773|prod]  (app) PO: SIDEBYSIDE,APIPROXY.

What can I do and check to get the API running?
@
@pierre.faurel - any ideas from your side? That would be amazing!
Many thanks to all of you!
It is a great community! Thanks again!


eikoneikon-data-apiworkspaceworkspace-data-apirefinitiv-dataplatform-eikonpythonapi
icon clock
10 |1500

Up to 2 attachments (including images) can be used with a maximum of 5.0 MiB each and 10.0 MiB total.

Upvotes
Accepted
21 0 0 4

@chavalit.jintamalit

@Alex Putkov.

Some very very basic mistake! Oh my dear.... I had a typo in my eikon.cfg file using a string in my cfg file!

cfg = cp.ConfigParser() cfg.read('eikon.cfg') # adjust for different file location app_id = cfg.get('eikon','app_id') ek.set_app_key(app_id) 

Everybody →
eikon.cfg file should look like this:

[eikon]
app_id = XXXXXXXXXXXXXXXXXXXXXXXXXXX0

Remember to not use quotes / string
app_id = " XXXXXXXXXXXXXXXXXXXXXXXXXXX0 "

Everything is working as suggested!

Oh my goodness!

Many many thanks again for checking my complete environment!

P.S.

By the way! There is no error handling involved for this mistake!


icon clock
10 |1500

Up to 2 attachments (including images) can be used with a maximum of 5.0 MiB each and 10.0 MiB total.

Thanks for letting us know.
Have fun with the API.

Upvotes
18k 21 12 20

Hi @STATA

2. You can use this command in a command line to upgrade eikon to the latest version

pip install eikon

And you can use tho command to check eikon API version

pip show eikon

This is the current version as of now:

Name: eikon
Version: 0.1.13
Summary: Python package for retrieving Eikon data.

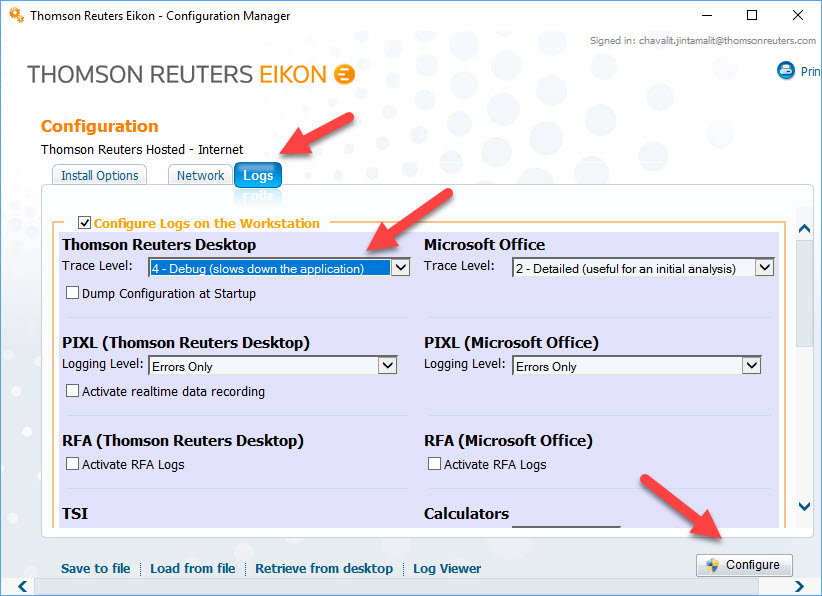
3. You have to go to enable log in debug level.

Please follow these steps:

3.1 Shutdown Eikon Desktop

3.2 Start >> Thomson Reuters >> Configuration Manager

3.3 Go to "Log" tab and enable debug log level.

3.4 Click on Configure

3.5 Launch Eikon Desktop app again

3.6 Try to locate the following output:

[2019-04-29 15:17:59.747|1|api-svc|1|INFO] PO: SIDEBYSIDE,APIPROXY
[2019-04-29 15:17:59.748|1|api-svc|3|DEBUG] create SIDEBYSIDE
[2019-04-29 15:17:59.749|1|api-svc|3|DEBUG] create APIPROXY
...
...
[2019-04-29 15:17:59.888|1|api-svc|1|INFO] Start server...
...
...
[2019-04-29 15:17:59.902|1|api-svc|2|DEBUG] onStarted: 9000
...
...
[2019-04-29 15:17:59.920|1|api-svc|1|INFO] Listening to port=9000

log.jpg (154.1 KiB)
icon clock
10 |1500

Up to 2 attachments (including images) can be used with a maximum of 5.0 MiB each and 10.0 MiB total.

Upvotes
39.2k 75 11 27

It looks like the log file was created with the default trace level. You need to increase the logging trace level. Start Eikon Configuration Manager from All Programs - Thomson Reuters - Thomson Reuters Eikon Tools. In the Configuration Manager select the Logs tab, check Configure Logs on the Workstation box, set Trace Level for Thomson Reuters Desktop to 4 - Debug and click Configure. Now restart Eikon and check SxS log file. It should have a lot more info now. It's probably best if you upload the log file here, so we can analyze it.

icon clock
10 |1500

Up to 2 attachments (including images) can be used with a maximum of 5.0 MiB each and 10.0 MiB total.

Upvotes
21 0 0 4

1 .
run "netstat -anb" as Administrator from the Command Prompt

Port 9000 is listening.

2. Upload your dump

sxs20190429173737000p11920.txt

@Alex Putkov.

3. Could it be a problem running - for simplicity of system management - a Jupyter environment in a docker container the problem?
It seems a bit like that for me now....

Thanks again everybody!

icon clock
10 |1500

Up to 2 attachments (including images) can be used with a maximum of 5.0 MiB each and 10.0 MiB total.

Is the Jupyter notebook running on your local machine or on other machine ?

Upvotes
39.2k 75 11 27

@STATA
I looked at the log file you provided and couldn't see anything out of the ordinary there. Your Eikon API Proxy appears to be functioning as expected.
I'm not an expert in containers, but my understanding is that if you're running Jupyter in a Docker container, your container by default has a separate network stack from the host's network stack. Even if you've mapped local port 9000 between the container and the host, an HTTP request from Jupyter will appear to Eikon API Proxy as coming from a different machine, not from the localhost. Eikon API Proxy rejects any HTTP requests not originating from the localhost. I've never tried this myself, and again I'm not an expert in containers, but perhaps you can make this setup work by using the host's network stack in your container running Jupyter? Although it also appears that Docker's --network host option is only supported on Linux, so perhaps it won't work after all.

icon clock
10 |1500

Up to 2 attachments (including images) can be used with a maximum of 5.0 MiB each and 10.0 MiB total.

Upvotes
21 0 0 4

@Alex Putkov.

Thank you so much for looking into the log file!

I installed Anaconda and running my Notebooks/JupiterLab now inside a virtualenv.
It is still not possible to connect to the API - Eikon Desktop 4.0.47!

localhost is listing to port 9000 - but when I do open
http://localhost:9000/api/v1/data
Internal Server Error

Why is this? Where does it come from?

Thanks again!

P.S.:

http://localhost:9000/ping?all

{"port":9000,"mode":"eikon4","pid":12588,"hasSecure":true,"startedTime":"Tue Apr 30 2019 13:44:19 GMT+0200 (Mitteleuropäische Sommerzeit)","subApps":[{"path":"/heap"},{"path":"/ping"},{"path":"/sxs","data":{"hasSecure":true,"sxsApps":{}}},{"path":"/api"}]}

icon clock
10 |1500

Up to 2 attachments (including images) can be used with a maximum of 5.0 MiB each and 10.0 MiB total.

FYI - On my machine with a working API.

If I try to access to http://localhost:9000/api/v1/data

I also receive "Internal Server Error"

Upvotes
18k 21 12 20

I used rawcap (download from here) to capture network on my localhost interface.

I launched rawcap and use Python code in command line to make a few API calls.

Then I got a pcap file which show me that the connection is ok.

I think it worth to check if the connection to your localhost port 9000 is ok on your virualenv or not.


port9000.jpg (158.2 KiB)
icon clock
10 |1500

Up to 2 attachments (including images) can be used with a maximum of 5.0 MiB each and 10.0 MiB total.

Click below to post an Idea Post Idea