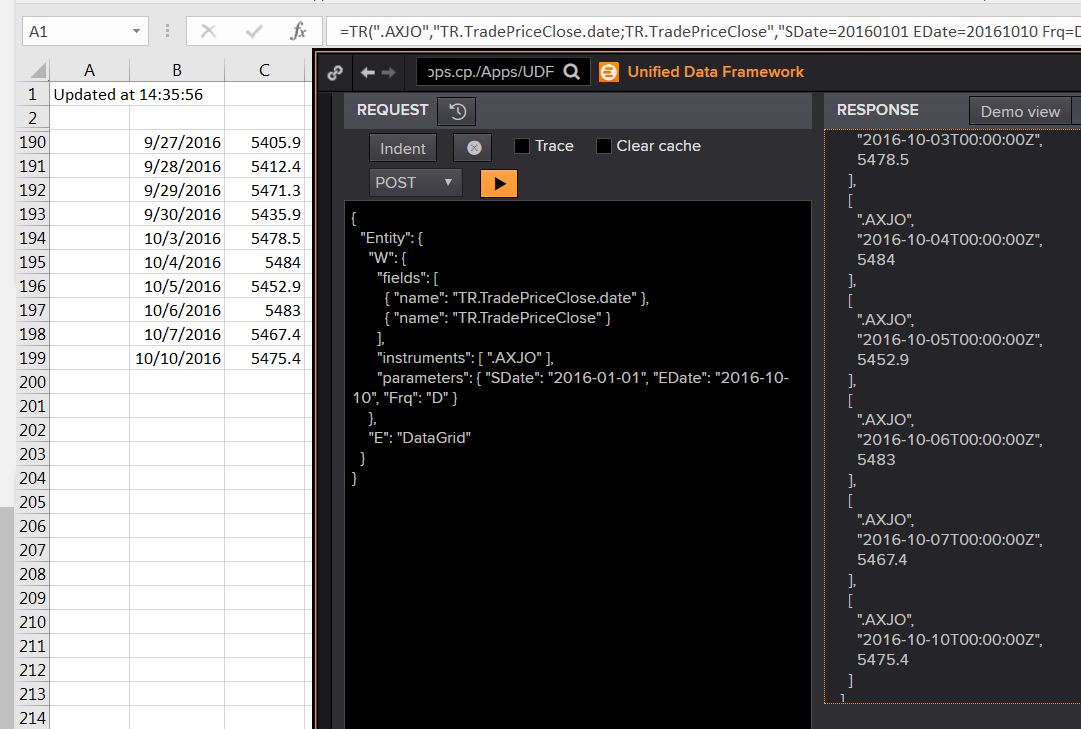
I'm trying to basically replicate the following excel formula using the DataGrid api:
=TR(".AXJO","TR.TradePriceClose.date;TR.TradePriceClose","SDate=20160101 EDate=20161010 Frq=D",B3)
To do that my request ends up looking like:
{
  "Entity": {
    "W": {
      "fields": [
        { "name": "TR.TradePriceClose.date" },
        { "name": "TR.TradePriceClose" }
      ],
      "instruments": [ ".AXJO" ],
      "parameters": { "SDate": "2016-01-01", "EDate": "2016-10-10", "Frq": "D" }
    },
    "E": "DataGrid"
  }
}
However while the excel formula works fine, the dates & close prices end up being returned misaligned when using DataGrid. The end of the response payload looks like the following:
...
[".AXJO", "2016-09-27T00:00:00Z", 5452.925],
[".AXJO", "2016-09-28T00:00:00Z", 5483.031],
[".AXJO", "2016-09-29T00:00:00Z", 5467.39],
[".AXJO", "2016-09-30T00:00:00Z", 5475.431],
[".AXJO", "2016-10-03T00:00:00Z", ""],
[".AXJO", "2016-10-04T00:00:00Z", ""],
[".AXJO", "2016-10-05T00:00:00Z", ""],
[".AXJO", "2016-10-06T00:00:00Z", ""],
[".AXJO", "2016-10-07T00:00:00Z", ""],
[".AXJO", "2016-10-10T00:00:00Z", ""]
Note that 5475.431 is the close price for Oct 10. The number of blanks corresponds to the number of holidays in the window, so eg a request for the last 10 days of data will appear to have worked just fine.


