Hi Team,
Good day.
How to get a time series of Implied Volatility for 1 month option for AAPL, FB for last 3 years using python code?
Thank you.
For a deeper look into our Eikon Data API, look into:
Overview | Quickstart | Documentation | Downloads | Tutorials | Articles
Hi Team,
Good day.
How to get a time series of Implied Volatility for 1 month option for AAPL, FB for last 3 years using python code?
Thank you.

Hello @VyaJunaine.Gutierrez ,
Sorry to hear that the discussion of a similar requirement and how it was solved on the suggested forum thread was not helpful to you, and you were unable to adapt the python code that was accepted as the solution:
df,e = ek.get_data('VODATMIV.L',
                   ['TR.30DAYATTHEMONEYIMPLIEDVOLATILITYINDEXFORPUTOPTIONS.Date',
                    'TR.30DAYATTHEMONEYIMPLIEDVOLATILITYINDEXFORPUTOPTIONS'
                   ],
                   {'SDate':'20140903','EDate':'20150902','Frq':'D'})
df.sort_index(ascending=False, inplace=True)
df
with your required instrument and your required dates.
---
So let us proceed to getting the exact details that you require using the same approach, as it was done on the suggested discussion thread:
Do you have the Excel formula that results in what you are looking to achieve in python? Please share the formula and I will try to translate it into python for you.
If you require a hand to derive the requirement formula first, please contact Refinitiv Workspace/Eikon content experts via Refinitiv Helpdesk Online -> Content -> Refinitiv Workspace/Eikon directly, and share the formula with us?

Hello @VyaJunaine.Gutierrez ,
Would the approach used in this previous discussion thread be what you are looking for?
If you replace the instrument and start and end dates, with your required parameters.

Good day.
May you please assist in getting these details please?
Time series of Implied Volatility for 1 month option for AAPL, FB for last 3 years
Thank you.

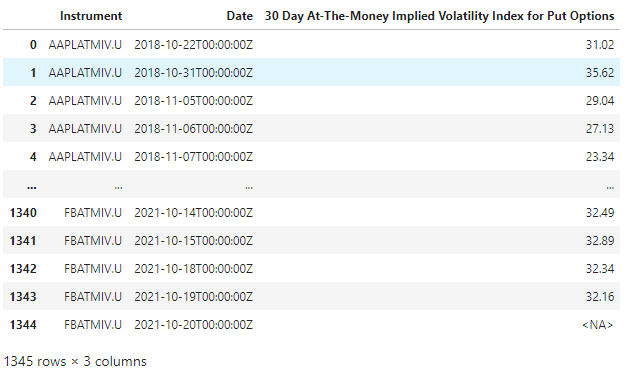
From information in the thread mentioned by Zoya above, I can update the RICs and get the code below. Is this what you're looking for?
df,e = ek.get_data(['AAPLATMIV.U','FBATMIV.U'],
                   ['TR.30DAYATTHEMONEYIMPLIEDVOLATILITYINDEXFORPUTOPTIONS.Date',
                    'TR.30DAYATTHEMONEYIMPLIEDVOLATILITYINDEXFORPUTOPTIONS'
                   ],
                   {'SDate':'-3Y','EDate':'0Y','Frq':'D'})
df.sort_index(ascending=False, inplace=True)
e


the RICs used, not sure if they're the correct one


