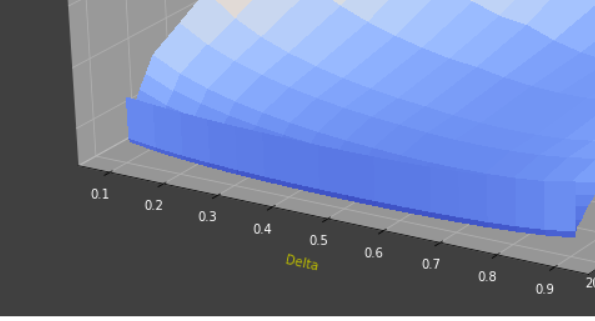
I am retrieving matrix of IPA FX Volatility surface by using sample file on Github:
https://github.com/Refinitiv-API-Samples/Article.RDPLibrary.Python.VolatilitySurfaces_Curves
However, Values of yAxis seems not correctly displayed on Matrix of FX Volatility Surface IPA.
Although setting up yValues as below in parameter of IPA FX Volatility Surface, the outcome of matrix displays different value of y-axis.
Parameter:
"-0.1","-0.15","-0.2","-0.25","-0.3","-0.35","-0.4","-0.45","0.5","0.45","0.4","0.35","0.3","0.25","0.2","0.15","0.1"

Matrix:
0.1, 0.2, 0.3, 0.4, 0.5, 0.6, 0.7, 0.8, 0.9

Is it suppose to be displayed this way or is there any way to adjust the value on y-axis?
I would appreciate your help.


