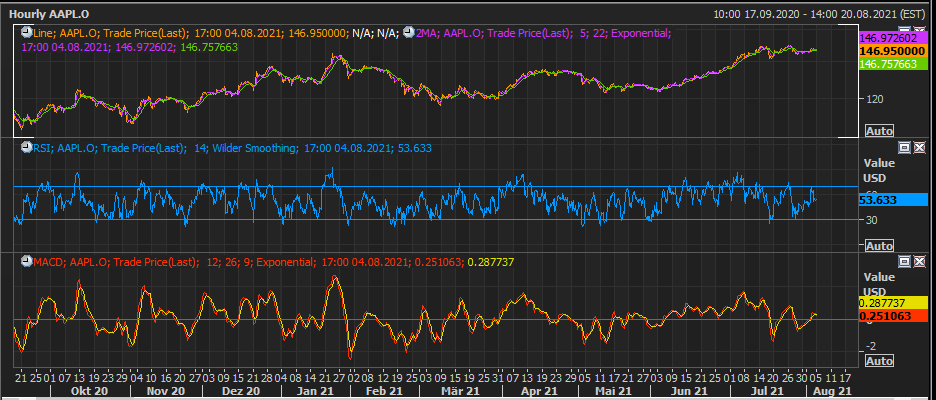
I am trying to get data for various technical indicators (RSI, Exponential Moving Average, MACD) with different time frequencies (Monthly, weekly, daily, hourly) using the Eikon Data or Datastream API.
My goal would be to get exactly the same data for the technical indicators in Python as the data I see in the charts of my Eikon Workspace.
- Home
- Anonymous
- Sign in
- Create
- Post an idea
- Create an article
- Spaces
- Alpha
- App Studio
- Block Chain
- Bot Platform
- Connected Risk APIs
- DSS
- Data Fusion
- Data Model Discovery
- Datastream
- Eikon COM
- Eikon Data APIs
- Electronic Trading
- Elektron
- Intelligent Tagging
- Legal One
- Messenger Bot
- Messenger Side by Side
- ONESOURCE
- Open Calais
- Open PermID
- Org ID
- PAM
- ProView
- ProView Internal
- Product Insight
- Project Tracking
- RDMS
- Refinitiv Data Platform
- Rose's Space
- Screening
- Side by Side Integration API
- TR Knowledge Graph
- TREP APIs
- TREP Infrastructure
- TRKD
- TRTH
- Thomson One Smart
- Transactions
- Velocity Analytics
- Wealth Management Web Services
- Workspace SDK
- World-Check Data File
- 中文论坛
- Explore
- Tags
- Questions
- Ideas
- Articles
- Users
- Badges
For a deeper look into our Eikon Data API, look into:
Overview | Quickstart | Documentation | Downloads | Tutorials | Articles
question
0
Upvotes
Accepted
12
●3 ●1 ●2
Technical indicators Eikon Data API or Datastream API
1628149372873.png
(40.7 KiB)
Comment

1 Answer
0
Upvotes
Accepted
6.7k
●8 ●6 ●7
@FRZH I have written a tutorial fro working with multiple moving averages from different timeframes. You would need to adapt the code to add whatever indicator you wanted as opposed to a simple moving average or you could look at this article by my colleague which uses a library called TA-Lib to generate a whole host of technical indicators. I hope this can help.


