For a deeper look into our Eikon Data API, look into:

Overview |  Quickstart |  Documentation |  Downloads |  Tutorials |  Articles

question

Upvotes
Accepted
1 0 1 0

OHCL for customer interval through EIKON API in R

Is it possible to get OHCL data for customer intervals such as 45 days or 72 days instead of the standard daily, monthly, quarter, yearly etc.


rics <- list("BB.TO","AC.TO")
query_fields <- list("OPEN", "CLOSE", "HIGH", "LOW")

Want something like following in the interval parameters

mydata <- eikonapir::get_timeseries(  rics, fields = query_fields,  start_date = "2020-01-01T00:00:00",   end_date = "2020-11-01T00:00:00", interval = "42days"
eikoneikon-data-apiworkspaceworkspace-data-apirefinitiv-dataplatform-eikoninterval
icon clock
10 |1500

Up to 2 attachments (including images) can be used with a maximum of 5.0 MiB each and 10.0 MiB total.

Upvotes
Accepted
39.2k 75 11 27

@azam.yahya123

As requested, please find below the example

df = ek.get_timeseries('EUR=',['OPEN','HIGH','LOW','CLOSE'])
custom_int = '10D'
resampled_df = pd.DataFrame()
resampled_df['OPEN'] = df['OPEN'].resample(custom_int).ohlc()['open']
resampled_df['HIGH'] = df['HIGH'].resample(custom_int).max()
resampled_df['LOW'] = df['LOW'].resample(custom_int).min()
resampled_df['CLOSE'] = df['CLOSE'].resample(custom_int).ohlc()['close']
resampled_df
icon clock
10 |1500

Up to 2 attachments (including images) can be used with a maximum of 5.0 MiB each and 10.0 MiB total.

Upvotes
38.1k 71 35 53

@azam.yahya123

Refer to the Eikon Data APIs for Python - Reference Guide, the possible values for the interval are tick, minute, hour, daily, weekly, monthly, quarterly, yearly.

This also applies to Eikon Data API R.

icon clock
10 |1500

Up to 2 attachments (including images) can be used with a maximum of 5.0 MiB each and 10.0 MiB total.

Upvote
39.2k 75 11 27

@azam.yahya123

To add to the response by @jirapongse.phuriphanvichai, to create OHLC timeseries with a custom frequency such as 45 days, you could resample daily timeseries. In Python pandas offers pandas.Series.resample method, which makes this task very easy. I'm not sure if R offers similar capability. If not, I'm sure it can be developed fairly easily. Or you could use reticulate to utilize pandas methods.

icon clock
10 |1500

Up to 2 attachments (including images) can be used with a maximum of 5.0 MiB each and 10.0 MiB total.

Would be great if you can share reproducible example in Python for OHCL data with a custom interval.
Upvotes
38.1k 71 35 53

@azam.yahya123

Thank you @Alex Putkov. for sharing the code. I have tried to find the same function in R. The closest one is the to.period in XTS. However from my checking the date output looks strange.

Therefore, I have tried to implement the same function used to change the daily interval.

The function looks like:

ChangeDayIntervalMulRICs <- function(df, freq) {
  TIMESTAMP =  integer(0)
  class(TIMESTAMP) <- "Date"
  OPEN = c()
  HIGH = c()
  LOW = c()
  CLOSE = c()
  RIC = c()  
  for (p in unique(df$RIC)) {
      oneRIC = df[df$RIC == p,]
      firstDate = oneRIC[1,"TIMESTAMP"]
      lastDate = oneRIC[nrow(oneRIC),"TIMESTAMP"]
      intervalDate = firstDate + freq
        while(firstDate <= lastDate){
          temp = oneRIC[oneRIC$TIMESTAMP >= firstDate & oneRIC$TIMESTAMP < intervalDate,]
          TIMESTAMP = c(TIMESTAMP, firstDate)      
          OPEN = c(OPEN, temp[1,"OPEN"])     
          HIGH = c(HIGH, max(temp$HIGH))
          LOW = c(LOW, min(temp$LOW))
          CLOSE = c(CLOSE, temp[nrow(temp),"CLOSE"])
          RIC = c(RIC, p)
          firstDate = intervalDate
          intervalDate = intervalDate + freq
  }  
}       
  return(data.frame(TIMESTAMP,
                    OPEN,
                    HIGH,
                    LOW,
                    CLOSE,
                    RIC))
}

The code to use the function is:

rics <- list("BB.TO","AC.TO")
query_fields <- list("TIMESTAMP","OPEN","HIGH","LOW","CLOSE")
mydata <- eikonapir::get_timeseries(  rics, fields = query_fields,  
                                    start_date = "2020-01-01T00:00:00",   
                                    end_date = "2020-11-01T00:00:00",
                                    interval = "daily")
mydata$TIMESTAMP <- as.Date(mydata$TIMESTAMP,"%Y-%m-%d")
mydata$HIGH <- as.numeric(mydata$HIGH)
mydata$LOW <- as.numeric(mydata$LOW)
mydata$OPEN <- as.numeric(mydata$OPEN)
mydata$CLOSE <- as.numeric(mydata$CLOSE)
colnames(mydata)[[6]] <- "RIC"
mydata$RIC <- as.character(mydata$RIC)
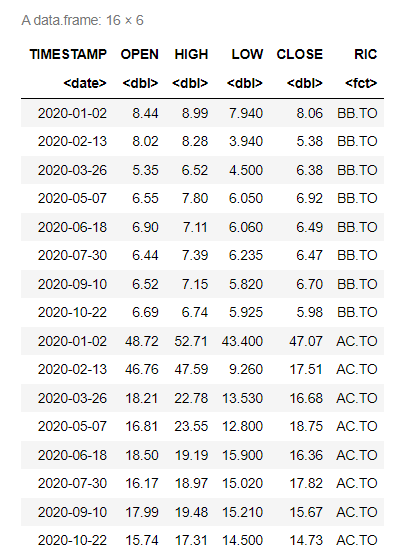
ChangeDayIntervalMulRICs(mydata, 42)

1626662466721.png

This is the sample function so it is not fully tested. You need to verify the data before using it in the production.


1626662466721.png (35.4 KiB)
icon clock
10 |1500

Up to 2 attachments (including images) can be used with a maximum of 5.0 MiB each and 10.0 MiB total.

Click below to post an Idea Post Idea