Can you advise how program in python the time series of the percentage of stocks in an index? Let's say the S&P 500, which their end of day prices are above or below their 50 (100 or 200) days moving average.
For a deeper look into our Eikon Data API, look into:
Overview | Quickstart | Documentation | Downloads | Tutorials | Articles
1
●0 ●0 ●0
How to program in python the time series of the percentage of stocks in an index

38.1k
●71 ●35 ●53
It is better to contact the Eikon Excel support team to verify how to do it in Eikon Excel with the =TR function.
Then, we can convert the formula used in Eikon Excel to Python code.
For example, "Let's say the S&P 500, which their end of day prices are above or below their 50 (100 or 200)". We can use the following code to get 50-Day SMA.
df, err = ek.get_data("0#.SPX",["TR.Price50DayAverage","TR.PriceClose"])
df
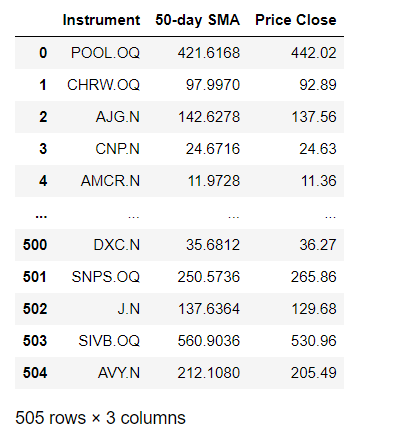
Then, we can calculate the percentage of stocks that have end-of-day prices above 50-day SMA.
(len(df[df["Price Close"] > df["50-day SMA"]])/len(df))*100
The output is 30.89%.
In conclusion, please directly the Eikon Excel support team via MyRefinitv (https://my.refinitiv.com/content/mytr/en/helpandsupport.html) to verify how to do it in Eikon Excel. Then, we can convert the Excel formula to the Python code that uses Eikon Data API to retrieve the data.