For a deeper look into our Eikon Data API, look into:

Overview |  Quickstart |  Documentation |  Downloads |  Tutorials |  Articles

question

Upvotes
1 0 0 0

cufflinks make charts

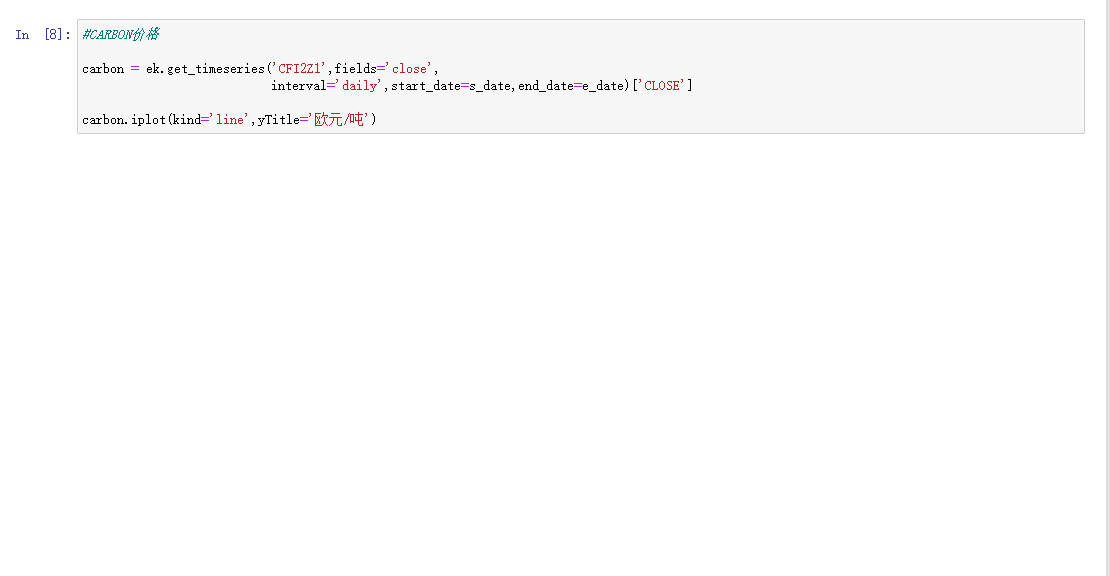
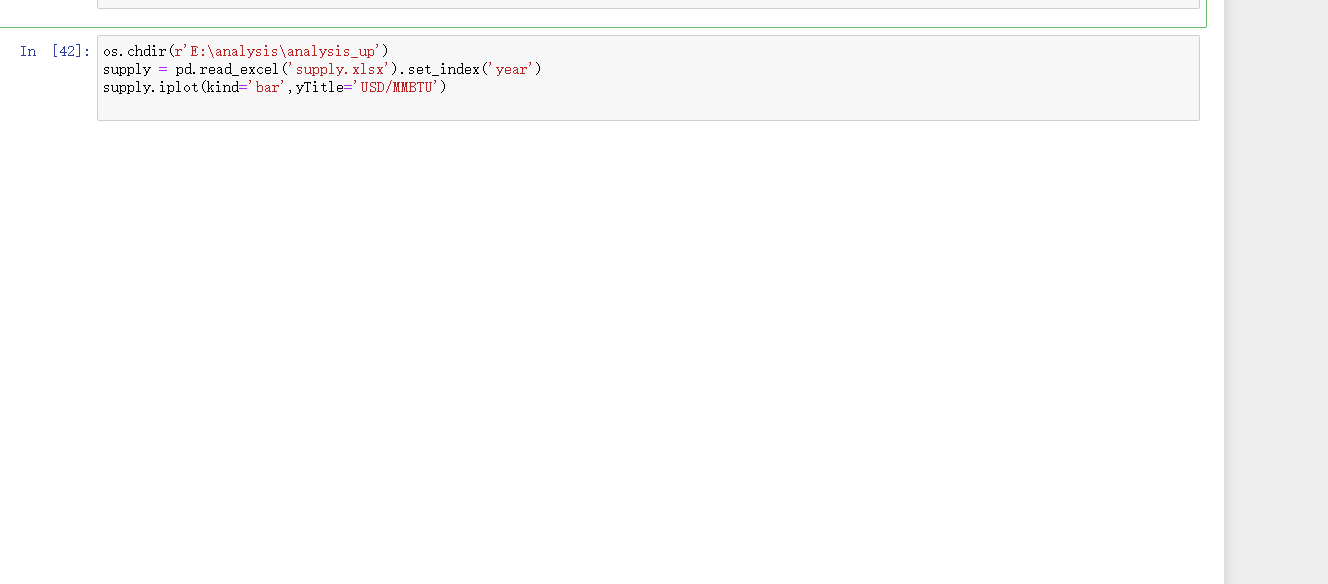
I participated in eikon api class and learned to use cufflinks to draw charts with eikon data.However,recently when I use cufflinks I find the chart cannot be shown on jupyter notebook.I try to change the internet explorer but still fail to draw.The code is as follows.Can you help me?


eikoneikon-data-apiworkspaceworkspace-data-apirefinitiv-dataplatform-eikon
1623035996611.png (19.5 KiB)
icon clock
10 |1500

Up to 2 attachments (including images) can be used with a maximum of 5.0 MiB each and 10.0 MiB total.

Upvotes
6.7k 8 6 7

@YanHan Can you include your import statements and tell us what plotly versions you are using. Thanks.

icon clock
10 |1500

Up to 2 attachments (including images) can be used with a maximum of 5.0 MiB each and 10.0 MiB total.

Upvotes
1 0 0 0

Hello,pls see my code and I've upgraded plotli to the newest version.However,cufflinks cannot work.


import pandas as pd

import cufflinks as cf

import os

import numpy as np

cf.set_config_file(offline=True)


1630484456383.png


1630484456383.png (22.5 KiB)
icon clock
10 |1500

Up to 2 attachments (including images) can be used with a maximum of 5.0 MiB each and 10.0 MiB total.

Upvotes
39.2k 75 11 27

@YanHan

This forums is dedicated to Refinitiv APIs. I don't think moderators on this forum can help you with this issue, because it's not related to any Refinitiv software, and because we cannot reproduce it. You may try your luck on Stackoverflow or other thematic forums. But frankly, it's probably much easier to rebuild your dev environment or create a new one. If the issue persists after you rebuild your dev environment, you may want to log it on cufflinks project site on Github.

icon clock
10 |1500

Up to 2 attachments (including images) can be used with a maximum of 5.0 MiB each and 10.0 MiB total.

Click below to post an Idea Post Idea