I've linked Refinitiv with Python and wanting to calculate a series of risk adjusted metrics (e.g. returns, std, beta, etc) for a bunch of shares. Relevant section of the codes after linking etc reads as follows:
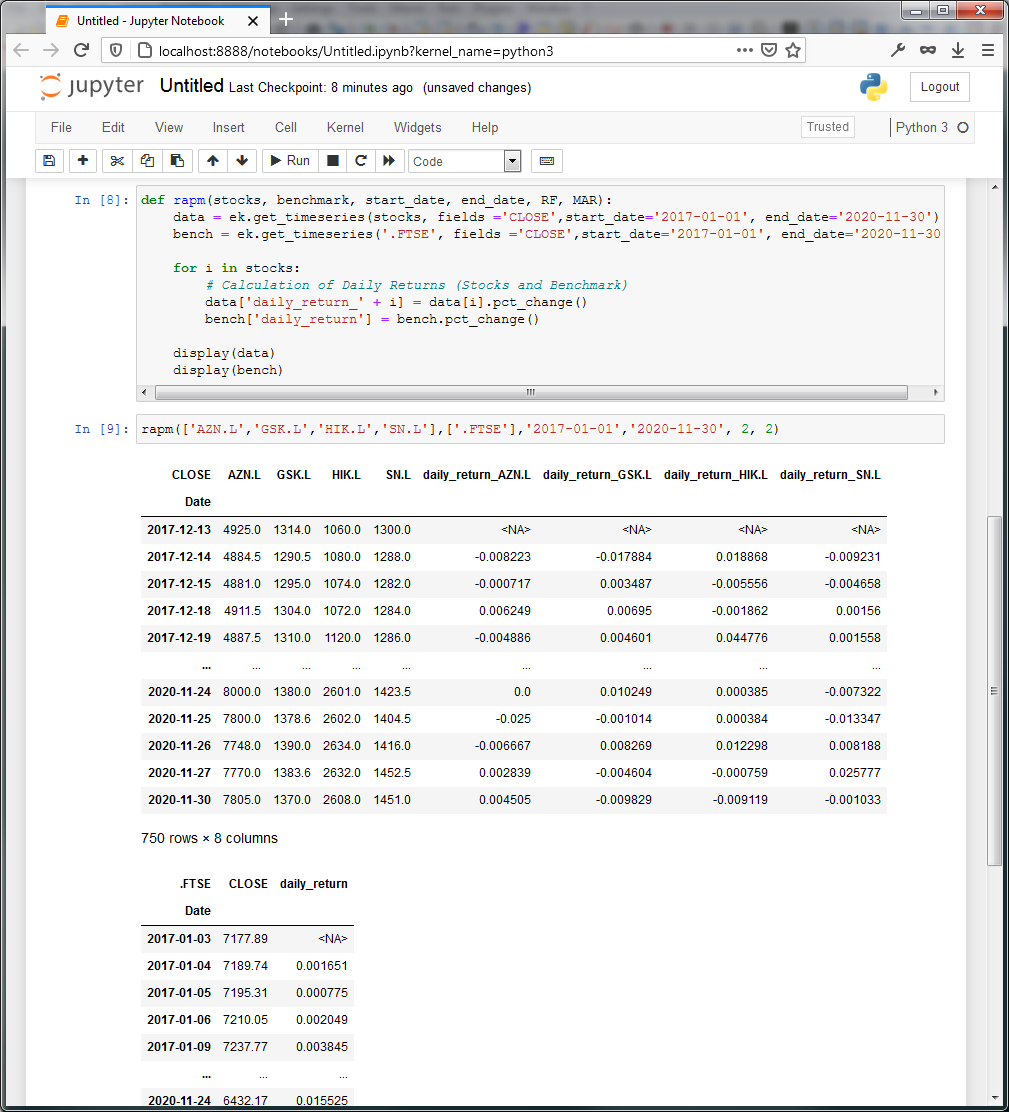
def rapm(stocks, benchmark, start_date, end_date, RF, MAR):
data = pd.DataFrame()
bench = pd.DataFrame()
data = ek.get_timeseries(stocks, fields ='CLOSE',start_date='2017-01-01', end_date='2020-11-30')
bench = ek.get_timeseries('.FTSE', fields ='CLOSE',start_date='2017-01-01', end_date='2020-11-30')
table = BeautifulTable(maxwidth=120)
for i in stocks:
# Calculation of Daily Returns (Stocks and Benchmark)
data['daily_return_' + i] = data[i].pct_change()
bench['daily_return'] = bench.pct_change()
.......................
rapm(['AZN.L','GSK.L','HIK.L','SN.L'],['.FTSE'],'2017-01-01','2020-11-30', 2, 2)
When I run the code, I get the error message:
KeyError: 'daily_return_AZN.L'
Fairly new to using Python and Refinitiv.
Any ideas on how to fix this will be greatly appreciated.