Hi Everyone,
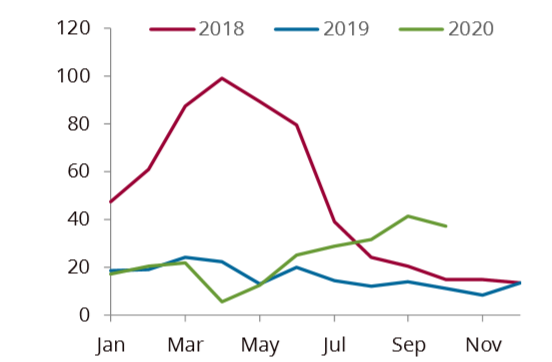
I'm attempting to pull some EIA data to generate a chart that shows the 5 year range of EIA Crude Stock Levels at Cushing. I tried figuring it out on my own, but the examples on github were overwhelming. Could someone please help me with how to generate a basic python script for how to create a chart like this? I'm looking for something that would show the last 5 years of data, all on one chart.

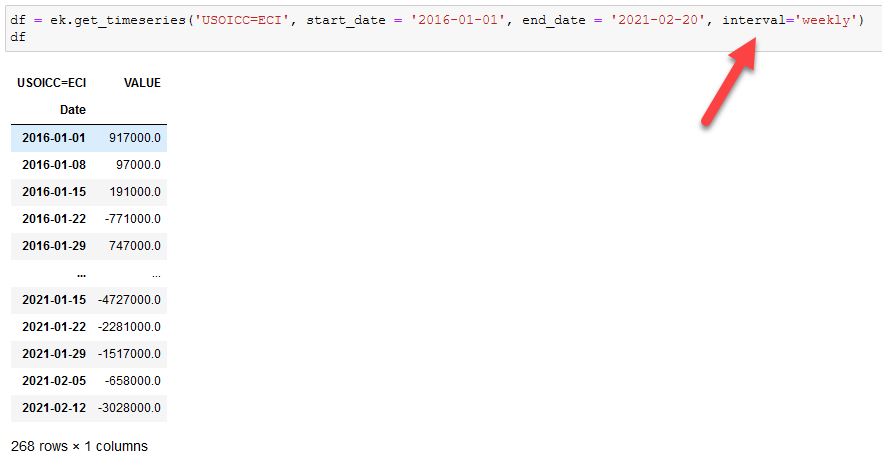
To start, I was writing some python to try to find the basic time series. I saw the Reuters code for this information as USOICC=ECI, however, this script didn't work (I put in my API key properly, and it worked for basic futures quotes like WTI already)
Thanks so much for your help!
Peter
import eikon as ek
ek.set_app_key('XXXXXXX')
df = ek.get_timeseries(['USOICC=ECI'],
                       start_date="2016-01-01",
                       end_date="2020-12-31",
                       )
df


