For a deeper look into our Eikon Data API, look into:

Overview |  Quickstart |  Documentation |  Downloads |  Tutorials |  Articles

question

Upvotes
Accepted
3 1 0 0

how to obtain esg ratings of the stoxx europe 600 index

Hello everybody. I would like to download the esg ratings for the stocks that are part of the Stoxx Europe 600 index. I opened the SCREENER app and filtered, for example, for negative screening. But how can I filter for only the stocks present in that index?

Also, is there a way to download the individual time series of the stocks that make up an index? For example, if I need to download the time series of the stocks of S&P 500 (Apple Inc, Microsoft Corp, Amazon, Facebook, J&J and so on) I Do I have to search and download them one by one or is there a way to download them all at once?

I need the .csv files so I can manipulate them in VBA or R software.

Thanks in advance for the help!

eikoneikon-data-apiworkspaceworkspace-data-apirefinitiv-dataplatform-eikonpythonesgconstituents
icon clock
10 |1500

Up to 2 attachments (including images) can be used with a maximum of 5.0 MiB each and 10.0 MiB total.

Upvote
Accepted
13k 32 12 18

Hello,

This question references Eikon API, but is posted under RDP. Please move it to right category, or else let us know that you indeed need help with RDP API.

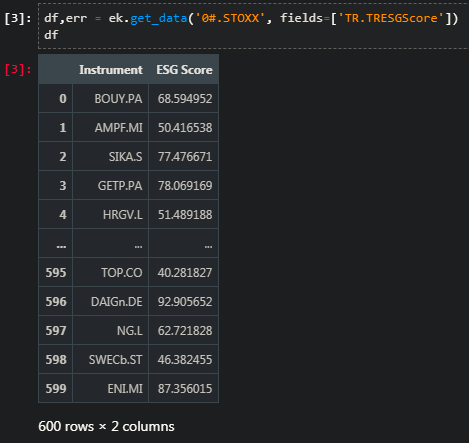
The ESG Score for STOXX 600 index is not pre-calculated by Refinitiv, but it is easy to do this in the Eikon API. Here are the code snippets to do so:

df,err = ek.get_data('0#.STOXX', fields=['TR.TRESGScore'])
print('ESG coverage {}%'.format(df['ESG Score'].count()/len(df)*100))
>>> ESG coverage 99.33333333333333%


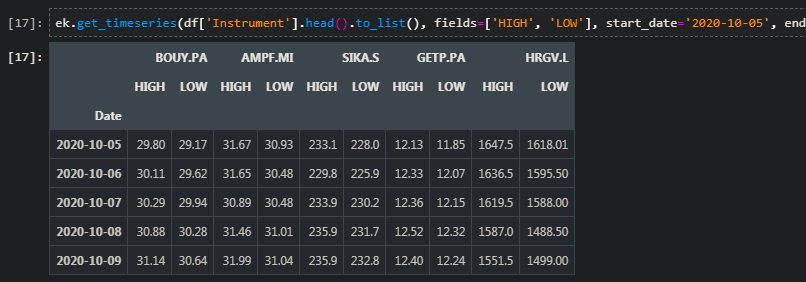
To get the timeseries data for index constituent:

ek.get_timeseries(df['Instrument'].head().to_list(), fields=['HIGH', 'LOW'], start_date='2020-10-05', end_date='2020-10-09', interval='daily')

Here, I am getting data for a subset, since trying to get timeseries for 600 instruments is throwing an Eikon error.

Also note that, you can directly use Eikon Data API in R language, using the open source R package. It is not officially supported by Refinitiv, but you can search its usage in these forums. Example: https://community.developers.refinitiv.com/questions/35606/r-compatibility-with-eikon-api.html


1602881589817.png (16.6 KiB)
1602881661706.png (21.1 KiB)
icon clock
10 |1500

Up to 2 attachments (including images) can be used with a maximum of 5.0 MiB each and 10.0 MiB total.

Upvotes
3 1 0 0

@Gurpreet I apologize for having the wrong section, I have remedied. This is my first time using Thomson Reuters Eikon, I am writing my master's thesis and I need to download that data. I thought it was not necessary to do this via code.


These codes you kindly wrote me where can I copy them? Could you tell me some guides that I can download to learn how to do it? I need those ESG scores and then the adjusted price time series for only a few stocks that I will select (but I can do this from the app by getting the .csv file).

If they are not pre-calculated by Refinitiv, where do they come from?


Anyway thank you so much for replying.


icon clock
10 |1500

Up to 2 attachments (including images) can be used with a maximum of 5.0 MiB each and 10.0 MiB total.

You can learn Eikon API from quickstart and tutorials here.

Upvotes
7.6k 15 6 9

@user01

Regarding adjusted close price, please refer to Eikon Data APIs for Python - Reference Guide provided under section document.

get_timeseries function provides the option to set corax to adjusted or unadjusted . The following post also discusses the corax option and its exception.

https://community.developers.refinitiv.com/questions/44745/using-python-api-to-get-adjusted-price-of-stocks.html


Note that Python Pandas library also provides method to_csv to export the data to CSV file, and then you can use it in R or another programming language.

icon clock
10 |1500

Up to 2 attachments (including images) can be used with a maximum of 5.0 MiB each and 10.0 MiB total.

Upvotes
3 1 0 0

Thanks so much for the tip.


One last question: Once the ESG data is downloaded, I should divide it into quartiles and create a portfolio with the first quartile. I tried doing this directly on Thomson Eikon, setting equal weights, but I'm not sure if it calculates the portfolio's return series based on dividend-adjusted prices.

If I wanted to do it on the software and not through code how could I do?

icon clock
10 |1500

Up to 2 attachments (including images) can be used with a maximum of 5.0 MiB each and 10.0 MiB total.

Not sure what you are asking here, but you are free to slice and analyze the data however you want. Choose whatever algorithm suits your need and it can be implemented in the code. If you have any specific API question, I recommend that you start a new post for it.

Click below to post an Idea Post Idea