question

Upvotes
Accepted
45 4 3 6

.NET : Retrieve historical BID_YIELD currency curve

Hello,

I'm trying to extract historical bid yield for currency curve.

For my tests I selected the currency curve 0#EUBMK= with the constituent EU1YT=RR. (maturity 1 year).

Then I used the GetViewList function from .NET lib to retreive the name of the view : BID_YIELD

But when I request the timeSerie all the elements I receive have value=null. I only have access to the keys "Open","Close","High", "Low".

Is it then possible to retreive the value ?

When I try to extract historical par yield for industry curves I have no problem.

Thank you !

eikoneikon-com-apitime-series.netyield
icon clock
10 |1500

Up to 2 attachments (including images) can be used with a maximum of 5.0 MiB each and 10.0 MiB total.

Upvotes
Accepted
39.2k 75 11 27

@someName
I would certainly not recommend using AdxRtHistory object. It's a component that retrieves timeseries from a very old legacy infrastructure that is being actively sunset. Eikon .NET API is the right API to use for your purposes.
Would you mind giving an example of the mismatch in the values you see?
The close value returned for 10-May-2019 using the request in the following code snippet is -0.572, which is exactly the value you see in your screenshot for 1Y maturity.

request = timeSeries.SetupDataRequest("EU1YT=RR")
                .WithView("BID_YIELD")
                .WithInterval(CommonInterval.Daily)
                .From(new DateTime(2019, 5, 5))
                .To(new DateTime(2019, 5, 15))
                .OnDataReceived(DataReceivedCallback)
                .CreateAndSend();
icon clock
10 |1500

Up to 2 attachments (including images) can be used with a maximum of 5.0 MiB each and 10.0 MiB total.

Hi @Alex,

Thank you for answer !

So the value of the curve displayed on the screen (the screenshot) is actually contained in the "close" key ?

When I do the extraction for industry curve (BBEURENE1Y= for example) I have a specific key "value" containing the value of the par_yield AND the 4 other keys "open", "close", "high" and "low".

So for currency curve I was expecting to retrieve the value of bid yield inside of the "value" key (But that key does not exist anymore)

Maybe is it because by default the definition of BID_YIELD is actually the closing BID_YIELD ?

Thanks a lot for your help !

Hi @someName,

When you specify you want the 'BID_YIELD" view, all the values within 'open', 'close', 'high', 'low' represent the bid yield within the specific day. That is, the value it opened at, the low and high during the trading day and finally what it closed at. You should be choosing the 'close' value as the final value for bid yield on that trading day.

Yes, the value displayed in the screenshot comes from the 'close' key. Views that are updated frequently and are deemed important enough to warrant summarization into open, high, low, close for the interval will have 'open', 'high', 'low', 'close' keys. Views that are not summarized into open, high, low, close will typically have 'value' key. Some views may have both. For example a view that was originally not summarized started being summarized because the data started updating more frequently or because this data grew in importance. In this case 'open', 'high', 'low', 'close' keys would be introduced, but the 'value' key would still be kept for backwards compatibility. In this case 'close' and 'value' keys would contain the same series.

Upvotes
9.7k 49 38 60

Hi @someName,

Can you post the actual timeSeries call? Also, can you please elaborate what you mean by "value=null"?

I assume you are specifying the request to include the "BID_YIELD" view:


ahs.png (12.1 KiB)
icon clock
10 |1500

Up to 2 attachments (including images) can be used with a maximum of 5.0 MiB each and 10.0 MiB total.

Upvotes
9.7k 49 38 60

Hi @someName,

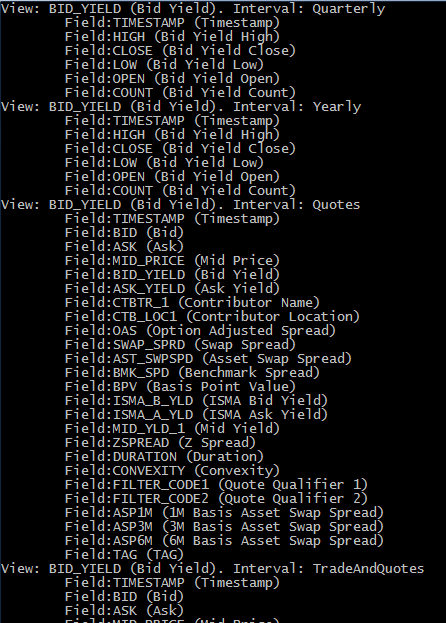
When you retrieve data via GetViewList, it is important to pay attention to the interval as they do provide different views of data. For example, you can see from my output below that a BID_YIELD view with an interval of "Yearly" contains a different set of fields than a "Quotes" interval. In fact, for the selected constituent (EU1YT=RR), there are only 2 intervals within the view that will carry additional values:

So, your timeSeries call could look like this:


ahs.png (37.0 KiB)
ahs.png (12.1 KiB)
icon clock
10 |1500

Up to 2 attachments (including images) can be used with a maximum of 5.0 MiB each and 10.0 MiB total.

Upvotes
45 4 3 6

Hi @nick,

Maybe it is easier to explain you what I'm trying to extract. I took a screenshot of the information I need to retrieve with the API.

It is the historical bid yield for a currency curve (0#EUBMK=).

According to your previous answer it seems that I can retreive this value only with Quotes interval (The value is in the bid_yield field). The problem is I would need to retreive this information summarized on daily records. (like for the curve in the screenshot)

But the Daily intervall only provide the same fields than Quaterly. (No bid yield then)

How could I then extract the information from the screenshot ?

The same operation is easy with industry curve because each interval provide the field "value" that contains the value of the requested view.

Thank you !currencycurve.jpg


currencycurve.jpg (152.7 KiB)
icon clock
10 |1500

Up to 2 attachments (including images) can be used with a maximum of 5.0 MiB each and 10.0 MiB total.

Hi @someName,

Thanks for providing additional details.

Content questions such as this one are best directed to Refinitiv Helpdesk, which you can reach by either using Contact Us capability in your Eikon application or by calling the Helpdesk number in your country. Once you get an understanding of the views/fields to help you achieve your goal, please come back here if you have API-specific questions. If the help desk was able to provide you with the necessary details, please share it here as well.

thanks.

Upvotes
45 4 3 6

Hi @nick,

I asked the question to the Refinitiv Helpdesk. I received an answer that describes how to do it with Excel and formula builder.

The Excel formula looks like this :

=TR("EU1YT=RR", "TR.BIDYIELD", "Frq=D SDate=2019-02-01 EDate=2009-08-09 CH=Fd RH=IN")

It returns exactly the information I need ! (1 bid yield by day with a depth history bigger than 90 days)

The Helpdesk was not able though to give me the solution for a .NET implementation. They say not having access to such documentation.

They sent me back on the developers community.

Yould you have then any idea to translate such request in .NET ?

Thank you !

icon clock
10 |1500

Up to 2 attachments (including images) can be used with a maximum of 5.0 MiB each and 10.0 MiB total.

Hi @someName,

Let me look into it.

Nick

Upvotes
9.7k 49 38 60

Hi @someName,

Try the following call:

The values for 'open', 'close', 'low', 'high' do in fact come in when I issue the above call. These values represent the values for 'BID_YIELD'.

Nick


ahs.png (12.5 KiB)
icon clock
10 |1500

Up to 2 attachments (including images) can be used with a maximum of 5.0 MiB each and 10.0 MiB total.

Hi @nick,

The values for 'open', 'close', 'low', 'high' are actually what I was able to retrieve. But these values does not represent the value of the bid yield as displayed by the chart I provided in the screenshot.

Or maybe there is a way to calculate the value of bid yield form these 4 values ?

Do you think I could use the AdxRtHistory module from .NET COM api to retrieve what I need ?

Thank you!

Upvotes
45 4 3 6

Ok now it is super clear !! Thanks a lot for your help !!!

icon clock
10 |1500

Up to 2 attachments (including images) can be used with a maximum of 5.0 MiB each and 10.0 MiB total.

Click below to post an Idea Post Idea