I'd like to download a composite time series usiing the EIKON Api . For example (3*LCOc1 - 2*CLc1).
¨what is the syntax that I have to use for the "get_timeseries" command ?
For a deeper look into our Eikon Data API, look into:
Overview | Quickstart | Documentation | Downloads | Tutorials | Articles
I'd like to download a composite time series usiing the EIKON Api . For example (3*LCOc1 - 2*CLc1).
¨what is the syntax that I have to use for the "get_timeseries" command ?

The composites are not available at the headend. They're calculated on the desktop by the chart app. You can easily replicate the same calculation. Try
df1 = ek.get_timeseries(['LCOc1'], ['OPEN','HIGH','LOW','CLOSE'])
df2 = ek.get_timeseries(['CLc1'], ['OPEN','HIGH','LOW','CLOSE'])
df3 = 3*df1 - 2*df2
df3.columns.name = '3*LCOc1-2*CL1'

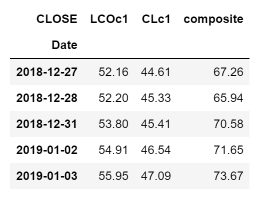
@davide.costanzo, you can request both time series individually, and run the formula on the response:
df = ek.get_timeseries(['LCOc1', 'CLc1'], 'CLOSE')
df['composite'] = 3*df['LCOc1']-2*df['CLc1']
df.head()


thanks for your answer. I actually need to download ( HIGH , LOW, OPEN , CLOSE ) for the composite expression.
It is something I can already see using the 'chart' tab in the TR interface and using the composite expression:
3*"Q%LCOc1"-2*"Q%CLc1"
see attachment:
So I just want to download that data.
thanks
Davide

Thank you for your answer.
This way of calculating the HIGH and LOW of the composite time series leads to a meaningless result.
This because , if A and B are two time series , it can be shown that
max(A-B) != max(A)-max(B)
and similarly
min(A-B) != min(A)-min(B) .
You can see this fact with an example. For example A= (0,3,0,2) and B = (3,4,1,4) . You would see that if one does (A-B) the correct (OPEN , HIGH, LOW, CLOSE) is (-3,2,-3,-2) .
Whereas simply subtracting
(OPEN , HIGH, LOW, CLOSE) - (OPEN ' , HIGH ', LOW ', CLOSE ')
would lead to (-3,-1,-1,-2) .
I verified in the 'Chart' tab , and indeed what you said is correct : that is the way it is calculated in Reuters.
I just wanted to point out the conceptual error.

You're right, this is a known limitation of the composites in the Chart app. The highs and lows are not accurate and shouldn't be relied upon. The only way to construct true composite highs and lows is to retrieve the entire tick history for all the instruments, construct the composite tick history and then summarize it into say daily intervals, which of course would be a much more expensive operation, not to mention that tick history going back more than 90 days is not available through Eikon. That's the reason why the composites in the Chart app implement this very inaccurate approximation.
