question

Upvotes
Accepted
646 6 13 25

AdxRtList - proper way to release memory

How can I release the memory after data received?

Here is my pseudo code, very similar to C++ COM API sample:

CComPtr<IAdxRtList> m_RtMgr;
...CreateAdxRtList((IUnknown **)&m_RtMgr);


CComQIPtr<IConnectionPointContainer> l_connectionPointContainer(m_RtMgr);
            if (l_connectionPointContainer)
            {
                l_hr = l_connectionPointContainer->FindConnectionPoint(__uuidof(IAdxRtListEvents),
                    &m_RtDataConnectionPoint);
                if (l_hr == S_OK)
                {
                    l_hr = m_RtDataConnectionPoint->Advise(&m_RtDataEventHandler, &m_RtDataEventHandlerCookie);
                    if (l_hr == S_OK)
                    {
                        // LOG. RtMgr initialized...
                    }
                }
            }
...


m_RtMgr->get_ListStatus(&a_listStatus);
if (a_listStatus == RT_LIST_RUNNING)
{
 m_RtMgr->StopUpdates();
 m_RtMgr->UnregisterAllItems();
}


l_hr = m_RtMgr->put_Source(BSTR(a_Source));
l_hr = m_RtMgr->RegisterItems(_variant_t(a_Instrument), _variant_t(a_FieldList));
HRESULT l_hr = m_RtMgr->StartUpdates(RT_MODE_IMAGE);


// When response is received:
HRESULT l_hr = m_RtMgr->get_ListItems(RT_IRV_ALL, RT_ICV_STATUS, &m_comData);

After results is parse, I run another query started from StopUpdates()...

Every request adds about 40mb to the memory usage. Is there a way to clean it up before next request?

Thanks.

eikonrefinitiv-realtimeeikon-com-api
icon clock
10 |1500

Up to 2 attachments (including images) can be used with a maximum of 5.0 MiB each and 10.0 MiB total.

sorry, code tag doesn't want to display my code..

Upvotes
Accepted
39.2k 75 11 27

I'm not sure this will help, but try removing the check for the value of a_listStatus and executing UnregisterAllItems method before every new request (or after extracting the data from AdxRtList object) irrespective of the value returned by get_ListStatus method. I'm thinking perhaps there's a logical error here. If you call StopUpdates before you check get_ListStatus, then get_ListStatus will return RT_LIST_UPDATES_STOPPED or RT_LIST_LINKS_CLOSED rather than RT_LIST_RUNNING, and then UnregisterAllItems method in the IF statement is never executed.

icon clock
10 |1500

Up to 2 attachments (including images) can be used with a maximum of 5.0 MiB each and 10.0 MiB total.

UnregisterAllItems throws if the status is not RT_LIST_RUNNING.

StopUpdates is called right after status check and before UnregisterAlItems..

Also, I tried to m_RtMgr.Release() and recreate it... no changes.

it looks like the memory increases during the wait for a response:

after

HRESULT l_hr = m_RtMgr->StartUpdates(RT_MODE_IMAGE);

and before a callback. So I've got some data in response and I don't see how to get rid of it..

Upvotes
39.2k 75 11 27

I see. This rather strongly points to the memory being used to store the data in the object and not being released immediately after calling UnregisterAllItems, which shouldn't be surprising. It also shouldn't be surprising that the memory is not released right after releasing the COM object. However that memory should be freed up at some point. In managed environment it's the job of the Garbage Collector, which could very well take it's sweet time to collect the garbage. I've seen instances where it takes several minutes for GC to pick up the trash. Your environment is native though, right? If you keep requesting data with your code, do you see the memory allocation stabilizing at some point? Or does it creep up indefinitely?

icon clock
10 |1500

Up to 2 attachments (including images) can be used with a maximum of 5.0 MiB each and 10.0 MiB total.

Upvotes
646 6 13 25

The app is in native c++, so no garbage collector...

I run 6 requests with 2000 instruments registered with 10 fields for each instrument.

The memory usage raise from 40 (after RSearch requests) to 200mb. I don't see it stops. I will try to run more requests. But I don't think it's normal. 200mb in memory after I disabled all result parsing. So after it's parsed it takes much less memory to have a copy of all data...

icon clock
10 |1500

Up to 2 attachments (including images) can be used with a maximum of 5.0 MiB each and 10.0 MiB total.

Upvotes
646 6 13 25

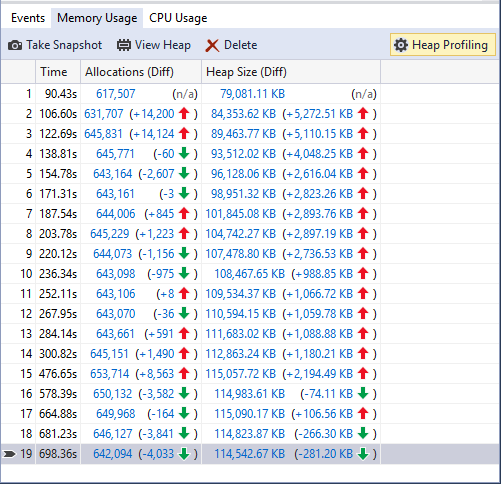
Ok, I run another test with 18 requests 2000 instruments with 10 fields each requests:

The memory increases fast to 200mb and then slowly to 250mb. It take 5-6 request to get to 200mb. So it's not so bad as it could be.

Also, when I destroy everything, I still have 100mb in the memory somehow..

icon clock
10 |1500

Up to 2 attachments (including images) can be used with a maximum of 5.0 MiB each and 10.0 MiB total.

Upvotes
646 6 13 25

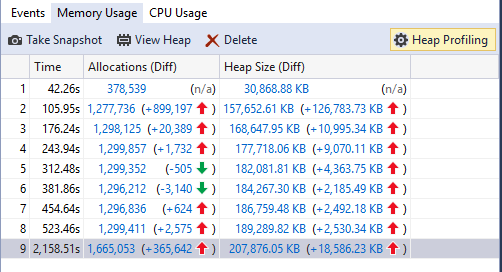
This is what I get if I run the same big request in the loop. About 7000 instruments registered and 10 fields. Request is only for snapshot. Line 2-8, memory snapshot after each response.

Line 1: connected to Eikon and RSearch ran.

Line 2: Creation of all object for Rtx request + first response

Line 3: the same request as in line 2.

......

Line 9: Ran about 15-20 minutes, so about 15-20 requests/responses without a break.

--------------------------------------------------------------------

Similar test with 2000 instruments in request:

The question stays the same: how can I clean the memory?


capture.png (20.6 KiB)
capture.png (43.9 KiB)
icon clock
10 |1500

Up to 2 attachments (including images) can be used with a maximum of 5.0 MiB each and 10.0 MiB total.

Upvotes
39.2k 75 11 27

Needless to say you have no control over how the object allocates memory internally. The most you can do is to try destroying it, which I understand you already did and you didn't see the memory being freed up immediately, which again shouldn't be surprising. The memory should be freed up to the OS at some point, but I don't think you have much control over when this happens. If you see a memory leak where the memory usage grows indefinitely, which I don't necessarily see in your tests (at least not yet), then we can troubleshoot it further. We can dig into VS Diagnostic Tools data to see how the memory gets allocated between the snapshots. We may also want to use VMMap from Sysinternals to profile memory utilization by the process. But if you do see memory usage peak and stabilize at some point, then I'm afraid it is what it is.

icon clock
10 |1500

Up to 2 attachments (including images) can be used with a maximum of 5.0 MiB each and 10.0 MiB total.

I tried to run indefinite loop with the same request for a long time and memory increase showed in VS Diagnostic tools is very low. Also I can see that in task manager the memory usage stays the same. So at this point, I would not worry about it.

My concern is about the memory usage after I destroy all the objects (seems I do it properly), but Diagnostic Tools still shows me tens of megabytes in the memory. And it links to rtx.dll and other eikon dlls.

Click below to post an Idea Post Idea